Hearing about an interview always makes us feel jittery. But we all know quite well that the entire process is worth suffering for as you may end up getting your dream job. A machine learning interview questions is no exception; in fact, it is nowadays one of the popular posts that is much in demand. It needs a whole lot of preparation and perseverance.
You may land yourself amid immense confusion if you think of preparing for everything. What you need to do is focus on the prime topics that will clarify all your core concepts. These Machine Learning Interview Questions will help you to crack upcoming interviews.
Top Machine learning Interview Questions and Answers
Let us dig in and study the top Machine Learning interview questions and answers below:
Question: What is Machine Learning? And how is it different from Artificial Intelligence?
Answer: Machine learning is a process by which a machine can perform from its experiment. A dataset is fed into the program that is capable of learning from the dataset. Then in the output, it knows how to recognize things fit inside that data set even if their machine on the program has never seen that example before. ML works on pattern recognition; on the other hand, AI exhibits the idea of intelligence and is about training a system to react as to how any human brain would do.
Question: Define three stages of building a model in Machine Learning.
Answer: The three stages of building a model in ML are:
- Model Building
Choosing an appropriate algorithm for the model and train it according to the requirement.
- Model Testing
Check the accuracy of the data by testing with data sets
- Applying a model
Make the required changes after testing and use the final model for real-time projects
Question: Explain parametric models with examples? How are they different from non-parametric models.
Answer: Models with a finite number of parameters are Parametric models. We need to know the parameters of the model to predict new data — for example, linear regression, logistic regression, and linear SVMs.
Models with an unbounded number of parameters are Non-parametric models, allowing for more flexibility. We need to know the parameters of the model and the state of the data observed to predict new data — for example, decision trees, k-nearest neighbors, and topic models using latent Dirichlet analysis.
Question: Differentiate between Type I and Type II error.
Answer:
- Type I Error: Reject the correct null hypothesis and is a severe error, also called false positive. The probability of making this error is the level of significance. It is claiming that something has happened when it hasn’t.
- Type II Error: Accept a false null hypothesis. The probability of making this error mainly depends on the sample size and population variance. This error is more likely to occur if the topic is difficult to test due to hard sampling or high variability. The probability of rejecting a false null hypothesis is 1- a.k.a Power of the test. It is claiming that nothing has happened while something has happened.
Question: What are the types of machine learning? Differentiate between them.
Answer:
| Supervised Learning | Unsupervised Learning | Reinforcement Learning | |
| Definition | Taught by labeled data. | Taught without any guidance using unlabeled data. | Reinforcement Learning is taught by self-learning by interacting with the surrounding environment. |
| Types of Problems | Regression and classification | Association and clustering | Reward-based |
| Type of data | Labeled data | Unlabeled data | No pre-defined data |
| Training | Involves external supervision. | Doesn’t involve supervision | Doesn’t involve supervision |
| Approach | Maps labeled input to output. | Discovers output by understanding patterns. | Trail and error method to discover output. |
| Popular Algorithms | Linear regression, KNN | K-means, C-means | Q-Learning |
You may read about Supervised and Unsupervised Learning in detail here.
Question: Explain Generalization, Overfitted, and Underfitted
Answer:
Generalization
A model is built and trained on datasets so that it can make accurate predictions on the unseen data. If the trained model is capable of making these accurate predictions on we can say that the model is generalized from the training set to test set.
Overfitted
When a model is fit too closely to the particularities of the training set and obtain a model that works well on the training set but is not able to generalize to new data is the case of overfitting. In simple words, the model was given to many features while training that it became confused and gave wrong analysis output.
Underfitted
When a model is too simple and doesn’t cover all the aspects and variability of the data, then the model might perform poorly on the training set. This choosing of the too-simple model is underfitting.
Question: What is inductive machine learning?
Answer:
Inductive machine learning involves the process of learning by examples, where a system tries to induce a general rule from a set of observed instances.
Inductive machine learning is an inductive step in which you learn a model from a given data set.
Question: Name some tools that are used for running the machine learning algorithm in parallel.
Answer: Some of the tools are:
- GPUs
- Matlab
- Map Reduce
- Spark
- Graphlab
- Giraph
- Vowpal
Question: What is the difference between Causation and Correlation? Explain with example.
Answer: Causation is the relationship between two variables such that occurrences of the other cause one of them.
Correlation is the relationship between two variables that are related to each other but not caused by each other.
For example, Inflation causes the price fluctuations in petrol and groceries, so inflation has a causation relationship with both of them. Between gasoline and groceries, there is a correlation that both of them can increase or decrease due to changes in inflation, but neither of them causes or impacts the other one.
Question: Define Sampling. Why do we need it?
Answer: Sampling is a process of choosing a subset from a target population that would serve as its representative. We use the data from the sample to understand the pattern in the community as a whole. Sampling is necessary because often, we can not gather or process the complete data within a reasonable time. Sampling can be performed with several techniques; some of them are Random Sampling, Stratified Sampling, and Clustering Sampling.
Question: State the difference between classification and regression
Answer: Classification is a kind of supervised learning technique where the output label is discrete or categorical. Regression, on the other hand, is a Supervised learning technique that is used to predict or continuous or real-valued variables.
For instance, predicting a stock price is a Regression problem because the stock price is a continuous variable that can take real-values whereas predicting whether the email is spam or not is a Classification problem because in this case, the value is discrete and has only two possible benefits yes, or no.
Question: What is stratified sampling?
Answer: Stratified sampling is a probability sampling technique wherein the entire population is divided into different subgroups called strata than a probability sample is drawn proportionally from each layer. For instance, in the case of binary classification, if the ratio of positive and negative labeled data were 9:1, then in stratified sampling, you would randomly select subsample from each of the positive and negative labeled datasets such that after sampling the ratio remains 9:1.
Question: Define confidence interval
Answer: It is an interval estimate which is likely to include an unknown population parameter, the estimated range being calculated from the given sample dataset. It is the range of values for which you are sure that the real value of the variable would lie.
Question: Define conditional probability.
Answer: Conditional probability is the measure of the likelihood of one event, given that one event has occurred. Let us consider two events are given A and B, then the conditional probability of A, given B has already occurred, is provided as:

where stands for the intersection. So, the conditional probability is the joint probability of both the events divided by the probability of event B.
Question: Explain what Bayes theorem is and why is it useful?
Answer: The theorem is used to describe the probability of an event based on the prior knowledge of other events related to it. For example, the probability of a person having a particular disease would be found on the symptoms shown.
Bayes theorem is mathematically formulated as:
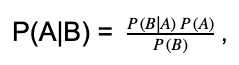
where A and B are the events and P(B) ≠ 0. Most of the type we want to find P(A|B), but we know P(B|A), so we can use Bayes theorem to find the missing values.
Question: How are True Positive Rate and Recall are related?
Answer: True Positive Rate is the same as Recall, also called sensitivity. The formula to calculate them:

where TP = true positive and FN = false negative.
Question: What is a probabilistic graphical model?
Answer: A probabilistic graphical model is a robust framework that represents the conditional dependence among the random variables in a graph structure. It can be used in modelling a large number of random variables having complex interactions with each other.
Question: What are the two representations of graphical models? Differentiate between them.
Answer: The two branches of the graphical representation of the distribution are Markov Networks and Bayesian Networks. Both of them differ in the set of independence that they can encode.
- Bayesian Networks: When a model structure is a Directed Acyclic Graph(DAG), the model represents a factorization of the joint probability of all the random variables. The Bayesian networks capture conditional independence between random variables and reduce the number of parameters required to estimate the joint probability distribution.
- Markov Networks: They are used when the underlying structure of the model in an undirected graph. They follow the Markov process, i.e. given the current states, the future states would be independent of the past states. Markov Network represents the distribution of the sequence of the nodes.
Question: How is the k-Nearest Neighbor (k-NN) algorithm different from the k-Means algorithm?
Answer:
- The fundamental difference between these algorithms is that k-NN is a Supervised algorithm, whereas k-Means is unsupervised.
- k-NN is a classification algorithm, and k-Means is a clustering algorithm.
- k-NN tries to classify an observation on its “k” surrounding neighbors. It is also known as a lazy learner because it does absolutely nothing at the training stage. On the other hand, the k-Means algorithm partitions the training data set into different clusters such that all the data points from other clusters. The algorithm tries to maintain enough separability between the clusters.
Question: How is KNN different from k-means clustering?
Answer:
| kNN | k-means clustering |
| Supervised learning algorithm used for classification. | The unsupervised method used for clustering. |
| Data is labelled for training. | No labelled data, machine trains itself. |
| The ‘k’ refers to the number of nearest neighbours of a target label. | k refers to the number of clusters, which is set at the beginning of the algorithm |
| When the algorithm gives the highest possible accuracy, the algorithm stops. | When no more clusters move from one to another, the algorithm is said to be complete. |
| We can optimize the algorithm using confusion matrix and cross-validation. | Optimization can be performed using silhouette and elbow methods. |
Question: Define F-test. Where would you use it?
Answer: An F-test is any statistical hypothesis test where the test statistic follows an F-distribution under the null hypothesis. If you have two models that have been fitted to a dataset, you can use F-test to identify the model which best suits the sample population.
Question: What is a chi-squared test?
Answer: Chi-squared is any statistical hypothesis test where the test statistic follows a chi-squared distribution (distribution of the sum of the squared standard normal deviates) under the null hypothesis. It measures how well the observed distribution of data fits the expected distribution if the variables are independent.
Question: What is the p-value? Why is it important?
Answer: The p-value represents the level of marginal significance while performing the minimal statistical test. It provides the smallest level of importance at which the null hypothesis can be rejected. A small p-value (generally <= 0.05) means that there is strong evidence against the null hypothesis, and therefore, you can refuse the null hypothesis. A significant p-value (>0.05) signifies weak evidence against the null hypothesis, and thus one cannot reject the null hypothesis. The smaller the p-value, the higher the significance with which the null hypothesis can be rejected.
Question: Explain how a ROC curve works.
Answer: ROC curve or Receiver Operating Characteristic Curve is the graphical representation of the performance of a classification model for all the classification thresholds. The graph shows two parameters, i.e. True Positive Rate (TPR) and False Positive Rate (FPR) at different classification thresholds. A typical ROC curveis as follows:

where the vertical axis is TPR, and the horizontal axis is FPR. Lowering the threshold will classify more items as positive, thereby increasing both TP and FP. To compute ROC, we use a sorting algorithm known as AUC (Area Under the Curve) which measures the whole 2-D area below the curve.
Question: Define precision and recall.
Answer: Precision and recall are measures used to evaluate the performance of a classification algorithm. In a perfect classifier, precision and recall are equal to 1. Precision is the fraction of relevant instances amongst the retrieved instances, whereas recall is the fraction of retrieved instances amongst the relevant instances.
Precision = true positive/(true positive + false positive)
Recall = true positive/(true positive + false negative)
Question: What is the difference between L1 and L2 regularization?
Answer: Both L1 and L2 regularization are done to avoid overfitting. L1 tries to calculate the median, whereas L2 calculates the mean of the data for the same. L1 is also called Lasso and L2, Ridge regularization technique.
In L1 regularization, features that are not important are eliminated, thus selecting only the most relevant features. In L2, the loss function tries to minimize loss by subtracting it from the average (mean) of the distribution of data.
Question: What is the difference between ‘training Set’ and ‘test Set’ in a Machine Learning Model?
Answer: Whenever we obtain a dataset, we split the data into two sets – training and testing. Usually, 70-80% of data is taken for training and rest for testing. The training dataset is used to create or build the model. The test dataset is used to evaluate and find the accuracy of the model.
Question: How Do You Handle Missing or Corrupted Data in a Dataset?
Answer: There are many ways to do this:
- remove or drop the missing rows or columns.
- replace them with another value.
- assign them a new category, if a trend/pattern is seen.
Question: What Are the Applications of Supervised Machine Learning in Modern Businesses?
Answer: There are many practical applications of supervised learning:
- image classification
- recommender systems
- dynamic pricing
- customer segmentation
- identify the most valuable customers (Customer lifetime value modeling)
Question: What is Semi-supervised Machine Learning?
Answer: Semi-supervised learning is an approach which is a mix of supervised and unsupervised learning mechanism. It combines a small amount of labelled data along with the huge amount of unlabelled data to be fed into the system for training purposes. Speech recognition is a good example of semi-supervised learning. This type of ML approach helps when you don’t have enough data and can use the techniques to increase the size of training data.
Question: What Are Unsupervised Machine Learning Techniques?
Answer: Unsupervised learning methods are used when we don’t have labelled data, i.e. only the input is known, and the output is unknown. Patterns, trends and underlying structure is identified and modelled using the unlabelled training dataset. Unsupervised learning methods are more accurate and predictable. The most popular algorithm is cluster analysis used for Exploratory Data Analysis (EDA) to get patterns, groupings and trends.
Question: What is an F1 score?
Answer: The F1 score is the measure of the model’s accuracy. It is a weighted average of the precision and recall of a model. The result ranges between 0 and 1, with 0 being the worst and 1 being the best model. F1 score is widely used in the field of Information Retrieval and Natural Language Processing.

Question: What is the Bayesian Classifier?
Answer: A Bayesian classifier is a probabilistic model which tries to minimize the probability of misclassification from the training dataset, it calculates the probabilities of the values of the features given the class labels and uses this information in the test dataset to predict the class given the feature values by using the Bayes rule.
Question: Explain prior probability, likelihood, and marginal likelihood in the context of the Naive Bayes Theorem.
Answer: Prior probability is the proportion of dependent(binary) variable of the dataset. It is the closest guess you can make about the class, without any further information. For example, Consider a dataset with a dependent variable binary, spam, or not spam. The proportion of spam is 75%, and not spam is 25%. Hence it can be estimated the chance of the new email being spam is 75%.
The likelihood is the probability of classifying a given observation as accurate in the presence of some other variable. For example, the probability of the word “CASH” being used in the spam message is a likelihood.
The marginal likelihood is the probability of the word “CASH” being used in any message.
Question: What is the confusion matrix? Explain it for a 2-class problem
Answer: A confusion matrix the table layout which describes the performance of a model on the test dataset for which valid values are known. For a binary or 2-class classification, which can take two values, 0 or false and 1 or real, a confusion matrix can be drawn as:
| Predicted Value 0 | Predicted Value 1 | |
| Actual Value 0 | Real Negative (TN) | False Positive (FP) |
| Actual Value 1 | False Negative (FN) | Real Positive (TP) |
Question: How can one choose a classifier based on the size of the training set?
Answer: If the training set is small, the high bias/low variance models, such as Naive Bayes, tend to perform better because they are less likely to overfit. If the training set, on the other hand, is large, then low bias/ high variance models, such as Logistic Regression, tend to perform better because they can reflect more complex relationships.
Question: What does the term decision boundary mean?
Answer: A decision boundary or a decision surface is a hypersurface which divides the underlying feature space into two subspaces, one for each class. If the decision boundary is a hyperplane, then the classes are linearly separable.

In the figure above, the red line is the decision boundary separating the green circle instances from the blue square ones.
Question: Define entropy?
Answer: Entropy is the measure of uncertainty associated with random variable Y. It is the expected number of bits required to communicate the value of the variable.

Where P(y) is the probability of Y having the value y, concerning Decision Trees, the entropy is used to find the best feature split at any node.
Question: What is a Decision Tree?
Answer: A Decision Tree uses a tree-like structure, as a predictive module to explicitly represent the decision and decision making. Each internal node of the decision tree is a feature, and each ongoing edge from that node represents the value that the function can take.
In the case of certain features, the number of outgoing edges is the number of different values in that category. In the case of a numerical feature, the number of outgoing edges is generally two, one in which the feature value is less than a real-valued amount and other, which is higher.
In the figure below, we have a binary output variable having values yes or no and certain features occupation, funded, and pension. The occupation is the essential feature, and based on its benefits, the Decision Tree feature branches out, finally predicting the output.

Question: What do you understand by information gain?
Answer: Information is used to identify the best feature to split the given training dataset. It selects the split S that most reduces the conditional entropy of output Y for training set D. In short, Information Gain is the change in the Entropy, H from a prior state to a new state when splitting on a feature:

We calculate Information Gain for all the features and features with the highest gain is chosen as the most important feature among all features.
Question: What is pruning, and why is it important?
Answer: Pruning is a technique that reduces the complexity of the final classifier by removing the subtrees from it, whose existence does not impact the accuracy of the model. In pruning, you grow the complete tree and then iteratively prune back some nodes until further pruning is harmful. This is done by evaluating the impact of pruning each node on the tuning data set accuracy and greedily removing the one that most improves the tuning dataset accuracy.
A straightforward way of pruning a Decision Tree is to impose a minimum on the number of training examples that reach a leaf. Pruning keeps the trees simple without affecting the overall accuracy. It helps solve the overfitting issue by reducing the size as well as the complexity of the tree.
Question: Walk me through k-Nearest Neighbor Algorithm
Answer: k-NN is a lazy learner algorithm, which means it does not do anything at the time of the training. Below are the steps performed at the time of testing. For any new test examples, k-NN
- first computes its distances from all the examples in the training dataset.
- then selects the k training samples with the lowest ranges
- and predicts the output label of the test example by either choosing the most occurring label from the selected training examples(in case of classification) or by calculating of them(in case of Regression)
Question: How does the value of k vary with bias and variance?
Answer: A significant value of k means a simpler model as it would take the average of a large number of training examples. So, the variance would decrease by increasing the value of k. A simpler model means underfitting and results in high bias. On the contrary, a small value of k means that the test example depends only on a small number of training examples, and hence, it would result in high variances and low bias.
Question: How would you vary k if there is a noise in the dataset.
Answer: We should increase k to handle any noise. A considerable k value would average out or nullify any noise or outlier in the given dataset.
Question: How can you speed up the model’s classification/prediction time?
Answer: There are two ways by which k-NN’s computation time is improved.
- Edited Nearest Neighbor: Instead of retaining all the training instances, select a subset of them that can still provide accurate classifications. Use either forward selection or backward elimination to select the subset of the instances, which can always represent other instances.
- K-dimensional Tree: It is a smart data structure used to perform nearest neighbor and range searches. A k-d tree is similar to the decision tree except that each internal node stores one data instance and splits on the median value of the feature having high variance.
Question: Define Logistic Regression
Answer: Logistic Regression is a statistical method for analyzing a dataset in which one or more independent data variables determine the outcome that can have only a limited number of values, i.e. the response variable is categorical. Logistic Regression is the go-to method for the classification problem when the response variable is binary.
Question: How to train a Logistic Regression model?
Answer: We use a logistic function for training a Logistic Regression model. Given the input data x, weight vector w(coefficients of the independent variable x) and the probability of the output label y, P(y) the logistic function is calculated as:

If P(y) > 0.5, we predict the output as 1, otherwise 0. Then based on the prediction error in the training instances, the whole process is repeated by updating the weights in each iteration. The process is stopped once we reach a good enough accuracy or complete all the iterators, and the final weights are used as the values to predict the outcome of the test instances.
Question: What is the link function in Logistic Regression?
Answer: A link function provides the relationship between the expected value of the response variable and the linear predictors. The Logistic Regression uses Logit as its link function, which is the term wx in the equation.
Question: Identify the most important aptitudes of a machine learning engineer?
Answer: Machine learning allows the computer to learn itself without being decidedly programmed. It helps the system to learn from experience and then improve from its mistakes. The intelligence system, which is based on machine learning, can learn from recorded data and past incidents. In-depth knowledge of statistics, probability, data modelling, programming language, as well as CS, Application of ML Libraries and algorithms, and software design is required to become a successful machine learning engineer.
Question: Indicate the top intents of machine learning?
Answer: The top intents of machine learning are stated below,
- The system gets information from the already established computations to give well-founded decisions and outputs.
- It locates certain patterns in the data and then makes certain predictions on it to provide answers on matters.
Question: Who is known as the inventor of Machine Learning?
Answer: Arthur Samuel is known as the inventor of Machine Learning. He worked with IBM and developed a computer program for playing checkers. This program that was made in the early 1950s was supported by the Alpha-beta pruning method because of the low storage facility available in computers. Hence the first machine learning was developed wherein the machine itself applied positions of the pieces on the board and offered a scoring function.
Question: Discuss the advantages of Machine Learning?
Answer: Machine learning is a traditional concept, but it has recently gained momentum due to its number of advantages. Some of the notable merits of Machine learning are the following:
- Effortlessly Recognizes Trends and Patterns: Machine learning can easily go through a huge amount of data and identify certain patterns and trends that are unable to be known to humans.
- No Human Involvement Required: Machine learning includes giving the capability to the machine to learn and improve predictions and algorithms on its own.
- Constant Betterment: Machine learning exhibits the quality to improve its accuracy and efficiency when the amount of data it handles increases.
- Extensive Applications: Machine learning serves a variety of users and can offer much more customized experience to customers as well as also targeting the right customer base.
Question: What are the demerits of machine learning?
Answer: Although machine learning has many merits to it, yet it isn’t flawless. There are few limitations to machine learning which are as follows:
- Data acquisition: Machine learning needs a huge amount of data to operate on, and the data requires to be impartial and of good quality.
- Interpretation of results: Sometimes, there might occur problem-related to the absolute interpretation of results related to the algorithm. So the algorithm must be chosen very carefully for this purpose.
- High level of error susceptibility: An error is likely to occur in the scenario of machine learning interface due to the autonomous, independent nature of this technology.
Question: List differences between bias and variance?
Answer: Bias is an error because of the incorrect or oversimplified assumptions in the learning algorithm that is to be used. This can cause the model to unfit the data, which causes difficulty in having high predictive accuracy, and it generalizes the knowledge from the training set to the testing set.
Whereas variance is a type of error that occurs due to a high level of difficulty in the learning algorithm that is being used. This causes the algorithm to be greatly sensitive to the high degree of variation in the training data, which can cause the model to overfit the data.
Question: What is understood from the term Deep Learning?
Answer: Deep learning is a subdivision of machine learning in artificial intelligence that is related to neural networks. It has the network capability of learning unsupervised from the data, which is unlabelled or unstructured. It is also known as a deep neural network or deep neural learning. It comprises algorithms that are inspired by the human brain, which is learned from large amounts of data. It helps in guiding the computer what is naturally seen in the human that is to learn from experience.
Question: What is the usage of the F1 score?
Answer: F1 is a determinant to judge the accuracy of the model. This model shows results in terms of 0 and 1, where 0 indicates the worse model, and 1 indicates the best model. This model is generally used in aspects of natural language processing and information retrieval. F1 is extensively used in machine learning, and it does not consider the true negatives. It is generally used in classification tests where true negatives don’t have any major role.
Question: Highlight the differences between the Generative model and the Discriminative model?
Answer: The aim of the Generative model is to generate new samples from the same distribution and new data instances, Whereas, the Discriminative model highlights the differences between different kinds of data instances. It tries to learn directly from the data and then classifies the data.
Conclusion
I hope this collection of the most essential machine learning interview questions help you to get through your interview. This interview can be intimidating as well as overwhelming, so we bring out to you the detailed explanation of the above questions to help to prepare better and crack the interviews with flying colors.
More ML interview questions? Here is a great course that will help you prepare comprehensively for upcoming ML interviews: Machine Learning Technical Interview.
For top statistics interview questions preparation, consider this book: Practical Statistics for Data Scientists: 50 Essential Concepts 1st Edition.
Do you have any further essential tips to share or any other frequently asked questions?
Comment your thoughts below!!
People are also reading:
- Top Machine Learning Courses
- Best Machine Learning Certification
- Best Machine Learning Books
- What is Machine Learning?
- Types of Machine Learning
- Difference between Supervised vs Unsupervised Machine Learning
- Decision Tree in Machine Learning
- Machine Learning Algorithm
- Difference between Data Science vs Machine Learning
- Difference between Machine Learning and Deep Learning
- Machine Learning Applications
