Cross-tabulation is a statistical technique used to summarize the relationship between categorical variables in a table format. It displays data in rows and columns, where each cell represents the frequency of a category combination.
How Does Cross-Tabulation Organize Data
Cross-tabulation structures categorical data into a table by counting occurrences for each combination of categories. This makes relationships and patterns between variables easy to compare and interpret.
- Load the dataset using Pandas
- Select variables for rows and columns Implementation of Cross-Tabulation in Python
- Use pd.crosstab() to compute frequencies
- Analyze the table for patterns and relationships
Here we implement cross-tabulation in Python using the Pandas library to analyze relationships between categorical variables.
Step 1: Import Required Libraries and Load the Dataset
Import Pandas library and load Dataset
You can download dataset from here
import pandas as pd
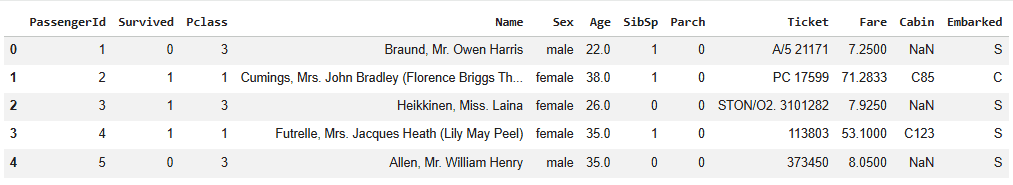
titanic_df = pd.read_csv("Titanic-Dataset.csv")
titanic_df.head(5)
Output:
Step 2: Identify Categorical and Target Variables
In this step, we select Pclass and Sex as categorical variables and Survived as the target variable to analyze survival patterns across passenger groups.
categorical_features = ['Pclass', 'Sex']
target_variable = 'Survived'
for col in categorical_features + [target_variable]:
    print(f"{col} unique values:", titanic_df[col].unique())
Output:
Pclass unique values: [3 1 2]
Sex unique values: ['male' 'female']
Survived unique values: [0 1]
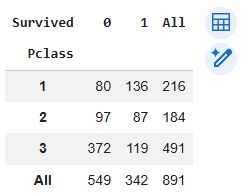
Step 3: Cross-Tabulation for Passenger Class vs Survival
Here we use the pd.crosstab() function to create a frequency table showing survival counts across passenger classes. The margins parameter adds row and column totals.
cross_tab_Pclass = pd.crosstab(
    titanic_df['Pclass'],
    titanic_df['Survived'],
    margins=True
)

cross_tab_Pclass
Output:
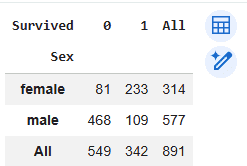
Step 4: Cross-Tabulation for Gender vs Survival
In this step we analyze survival outcomes based on gender using another cross-tabulation table.
cross_tab_gender = pd.crosstab(
    titanic_df['Sex'],
    titanic_df['Survived'],
    margins=True
)

cross_tab_gender
Output:
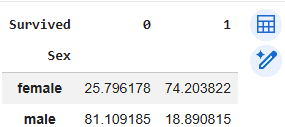
Step 5: Calculate Survival Percentages
Instead of looking only at raw counts, the table can be normalized to show survival percentages. This makes it easier to compare survival chances across different categories.
survival_rate_gender = pd.crosstab(
    titanic_df['Sex'],
    titanic_df['Survived'],
    normalize='index'
) * 100

survival_rate_gender
Output:
You can download full code from here.