Skewness and kurtosis are statistical measures that describe the shape of a distribution beyond basic central tendency. Skewness explains how symmetric or asymmetric the data is around its mean, while kurtosis explains how peaked the distribution is and how heavy or light its tails are.
Skewness
Skewness measures the asymmetry of a probability distribution around its mean. It indicates whether data values are stretched more toward the left or the right side, affecting the distribution’s overall balance.
- Helps understand the direction of extreme values.
- Influences the difference between mean, median and mode.
- Useful in identifying required transformations for modelling.
Types of Skewness
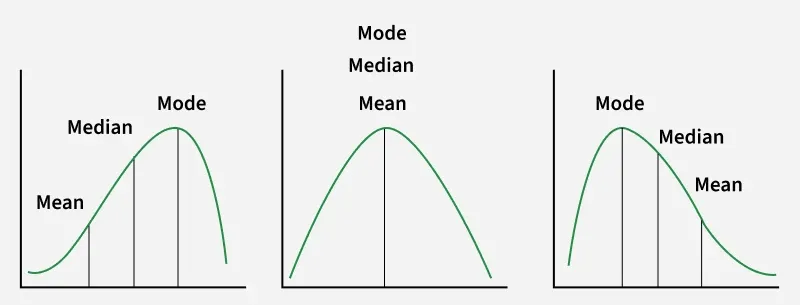
- Positive Skewness: It refers to a distribution where the right tail is longer or more stretched than the left. The majority of data points are concentrated on the lower-value side, while a few large values pull the mean to the right.
- Negative skewness: It refers to a distribution where the left tail is longer or more stretched than the right. Most data points lie on the higher-value side, while a few small values pull the mean to the left.
- Zero Skewness: It represents a perfectly symmetrical distribution, where the left and right sides mirror each other and extreme values occur equally on both sides.
Kurtosis
Kurtosis measures how sharp the peak of a distribution is and how heavy or light its tails are compared to a normal distribution. It shows how much of the data lies close to the center and how much appears in the extreme ends.
- Higher kurtosis implies more extreme outliers.
- Lower kurtosis implies fewer extreme values and smoother tails.
- Excess kurtosis (kurtosis − 3) is commonly used for interpretation.
Types of Kurtosis
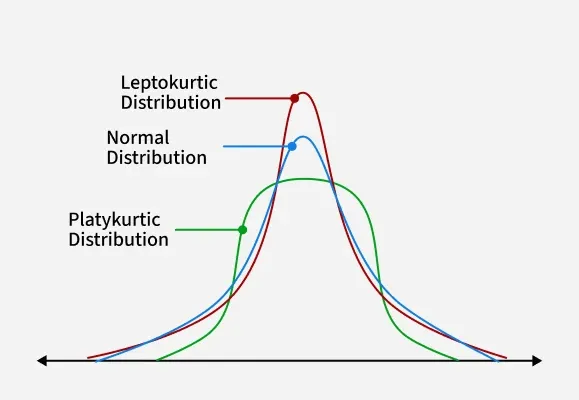
- Mesokurtic: Mesokurtic distributions have a kurtosis value around 3, indicating a moderate peak and tails similar to a normal distribution. They do not show unusually heavy or light tails.
- Leptokurtic: A leptokurtic distribution has kurtosis greater than 3. It has a sharp, narrow peak and heavy tails, meaning the data clusters tightly near the mean but also produces more
- Platykurtic: A platykurtic distribution has kurtosis less than 3. It features a flatter, wider peak and light tails, indicating fewer extreme values and more evenly spread data.
Skewness vs. Kurtosis
Let's compare skewness and kurtosis,
| Aspect | Skewness | Kurtosis |
|---|---|---|
| Core Purpose | Quantifies the asymmetry of a distribution | Quantifies the peakedness and tail weight of a distribution |
| Primary Focus | Direction and degree of horizontal asymmetry | Vertical structure and extremity of tail behaviour |
| Positive Values | Reflect a distribution with a longer or heavier right tail | Reflect a sharper peak with heavier tails and more extreme values |
| Negative Values | Reflect a distribution with a longer or heavier left tail | Reflect a flatter peak with lighter tails and fewer extreme values |
| Effect on Summary Statistics | Alters the relationship among mean, median and mode | Influences tail probability, variance concentration and outlier impact |
| Sensitivity | Sensitive to directional deviations and skewed clusters | Highly sensitive to occurrence and magnitude of extreme observations |
| Analytical Implication | Used to identify directional bias and underlying imbalance | Used to assess risk, extremity and departure from normal tail behaviour |
| Role in Distribution Shape | Describes shape horizontally | Describes shape vertically and in the tails |