The Population Stability Index (PSI) is a statistical tool used to measure how much the distribution of data changes between two datasets, usually between a training dataset and a new dataset. The PSI is widely used in credit scoring, risk management and financial modeling to ensure that models remain valid and stable. A high PSI score indicates a significant change in population distribution, while a low PSI score indicates stability.
Key Terms in PSI
- Population: This is the set of data points that is analyzed. It could be a collection of customers, transactions or any other subject under observation.
- Bins: The population data is often divided into bins or ranges based on specific characteristics. For example if we are analyzing income data, we might divide the population into bins like: "Low Income," "Medium Income," and "High Income".
- Observed Distribution: This is the actual distribution of the data for the time period we are currently analyzing.
- Expected Distribution: This is the reference distribution from the earlier time period or model, which is used to compare how the population has changed.
Importance of PSI
- Model Stability: It helps check whether a model trained on historical data remains valid when applied to new data.
- Detect Data Drifts: A high PSI score can indicate that the new data distribution has drifted significantly from the past, which may require recalibrating the model.
- Ensuring Consistency: It helps in ensuring that the population characteristics remain consistent, which is essential for maintaining predictive accuracy and fairness in models.
- Risk Management: In financial services, PSI is used to ensure that credit scoring models do not become outdated, ensuring accurate risk assessments.
Formula for PSI
The formula for calculating the Population Stability Index (PSI) is as follows:
\text{PSI} = \sum \left( (\text{Observed} - \text{Expected}) \times \ln\left(\frac{\text{Observed}}{\text{Expected}}\right) \right)
Where:
- Observed: Proportion of data in each bin for the current period.
- Expected: Proportion of data in each bin for the baseline period.
- ln: Natural logarithm.
A higher PSI indicates a greater shift between distributions, signaling potential issues like data drift.
Steps to calculate PSI
1. Define the Bins: First divide the data into bins based on the variable we are analyzing. For example, if we are working with age data, we could define bins for ranges such as 18-25, 26-35 and so on.
2. Calculate the Observed and Expected Proportions:
- The Observed Proportion refers to the proportion of data points in each bin for the current data set.
- The Expected Proportion refers to the proportion of data points in each bin for the historical data set or reference population.
3. Apply the PSI Formula: Use the formula to calculate the PSI for each bin. Multiply the difference between the observed and expected proportions by the natural logarithm of the ratio of observed to expected proportions. Sum the results for all bins.
4. Interpret the PSI: The PSI score helps determine whether there has been a shift in the population.
- PSI < 0.1: No significant change. The population is stable and the model remains valid.
- 0.1 <= PSI < 0.25: Moderate shift. The population has changed, but the model might still work with some adjustments.
- PSI >= 0.25: Significant change. There has been a large shift in the population and it is time to revisit the model or retrain it with updated data.
Let's understand the calculation of PSI with an example where we analyze the distribution of income levels in two different years 2020 ad 2021,
Step 1: Define Bias: Lets assume we have 3 income bins,
- Low Income: Less than $30,000
- Medium Income: $30,000 to $60,000
- High Income: More than $60,000
Step 2: Calculate Observed and Expected Proportions
| Income Range | Expected Distribution (2020) | Observed Distribution (2021) |
|---|---|---|
| Low Income | 0.4 | 0.35 |
| Medium Income | 0.3 | 0.25 |
| High Income | 0.3 | 0.4 |
Step 3: Apply the PSI formula
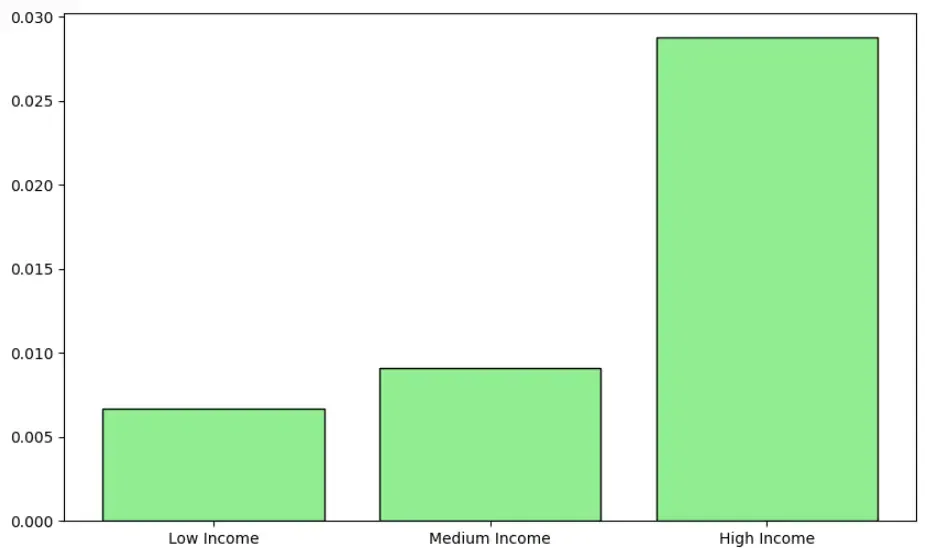
- For Low Income:
- For Medium Income:
- For High Income:
Step 4: Sum the Results
PSI=0.006675+0.009115+0.02877=0.04456
Step 5: Interpret the PSI: Since the PSI value is 0.04456 which is less than 0.1, we can conclude that there is no significant shift in the population between 2020 and 2021. The model is likely to remain stable and valid.
Applications of PSI
- Credit Scoring: PSI helps make sure that a credit scoring model still works well for the current population, especially after big changes in the economy or new rules are introduced.
- Risk Assessment: Banks and lenders use PSI to check if changes in things like borrower income levels might affect their lending models.
- Customer Segmentation: Marketing teams use PSI to verify that customer groups are still relevant over time.
- Fraud Detection: PSI helps spot changes in fraudulent behavior. If the pattern of fraud changes, it signals that fraud detection models may need updating or retraining to stay accurate.