Microsoft Azure - Configure Diagnostic Settings For Azure Subscription
Last Updated :
23 Jul, 2025
If you are managing cloud resources on Microsoft Azure, having Diagnostic Settings set up for your Azure Subscription is not a nice-to-have — it's necessary. Diagnostic Settings enable you to collect Activity Logs, such as who changed something, what they did, and when. From a security, compliance, and debugging standpoint, this capability is one of the most important features you can use within the Azure environment.
Why Configure Azure Diagnostic Settings
Azure Diagnostic Settings assist you in gathering, monitoring, and analyzing logs and metrics for your Azure resources — such as Virtual Machines, Storage Accounts, Key Vaults, or Network Security Groups — in one location. The feature is vital for security, troubleshooting, and compliance in cloud environments.
1. Monitor Azure Activity Logs
With diagnostic settings on, you can monitor every operation performed on your Azure resources:
- Who created, deleted, or updated a VM?
- When was the security group rule updated?
- Who changed a storage account or initiated an autoscale policy?
This is particularly useful in multi-administrator or DevOps shared environments. Activity Logs provide a detailed audit trail of user activity for security and accountability.
2. Troubleshoot Operational Issues
Azure Diagnostic Settings can record:
- Failed logins or access denials
- API call errors
- VM startup or shutdown failures
- Network problems or latency warnings
By forwarding diagnostic logs to Azure Monitor, Log Analytics, or Event Hubs, you can identify the root cause of problems instantly and fix issues without guessing.
3. Stay Compliant with Industry Standards
Most sectors require organizations to store logs for an extended period of time — up to 7 years, sometimes — as per regulations such as:
- GDPR (General Data Protection Regulation)
- HIPAA (Health Insurance Portability and Accountability Act)
- ISO 27001
- SOC 2
Azure Diagnostic Settings enable you to archive logs in a Storage Account for long-term storage or forward them to a SIEM tool for secure, compliant log storage.
4. Centralize Data
Diagnostic Settings can send logs from any Azure resource to:
- Log Analytics Workspace for deep queries and dashboards (Kusto Query Language)
- Event Hubs for third-party tool integration such as Splunk or Sentinel
- Storage Account for backup and archiving
Step-by-Step to Configure Diagnostic Settings
Follow the steps to configure the diagnostics for an Azure subscription.
Step 1: Log in to Azure Portal
Log in to Azure Portal and sign in with your account.
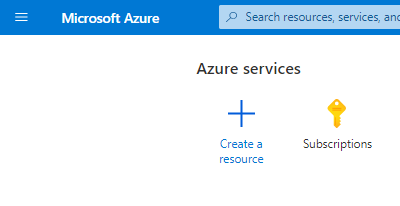
Step 2: Navigate to Your Subscription
Type “Subscriptions” in the search bar and select your active subscription from the list.
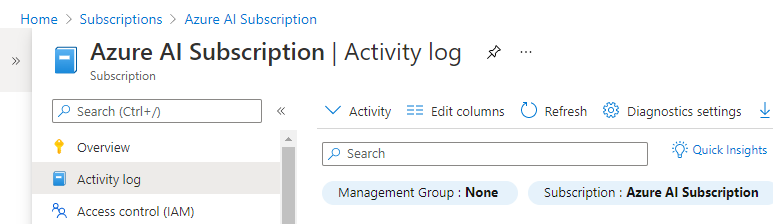
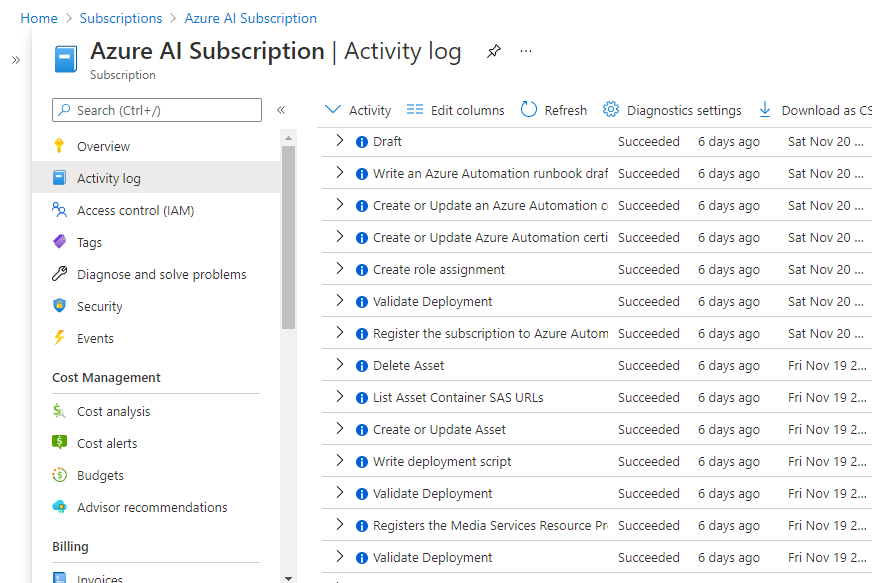
Step 3: Open Activity Log & Diagnostic Settings
In the left menu, click Activity log under Monitoring and click Diagnostic Settings (top of the page).
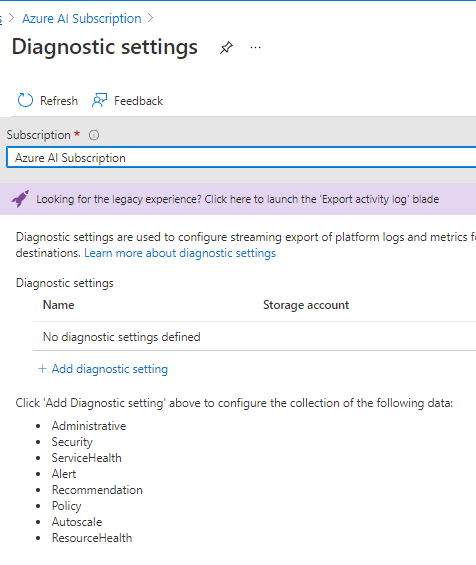
Step 4: Create a New Diagnostic Setting
Click + Add diagnostic setting and Name your setting (e.g., “Audit-Logs-Production”).
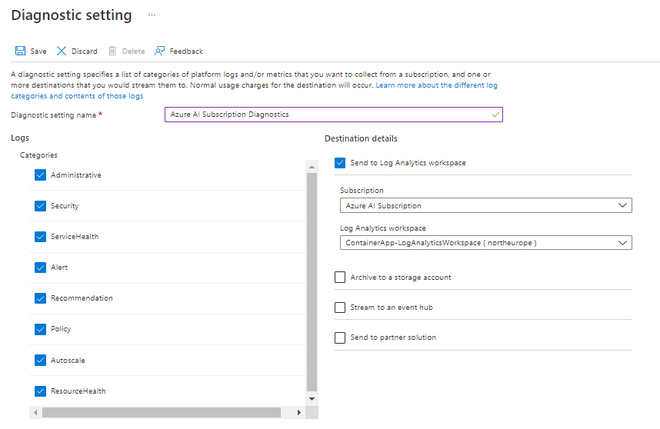
Step 5: Select Log Categories
The following are the Category logs (Select all the Category Logs):
| Category | What It Tracks |
|---|
| Administrative | Create/update/delete actions (e.g., VM modifications). |
| Security | Azure Security Center alerts. |
| ServiceHealth | Azure outages or maintenance updates. |
| Alert | Fired alerts from Azure Monitor. |
| Recommendation | Azure Advisor optimization tips. |
| Policy | Policy violations (e.g., resource location). |
| Autoscale | Scaling events for apps/VMs. |
| ResourceHealth | Resource availability (e.g., downtime). |
Step 6: Send Logs to Log Analytics Workspace
Under Destination details >> Select "Send to Log Analytics workspace" >> Subscription: Select your Active Azure Subscription (if you have multiple subscriptions and if you already have another Log Analytics Workspace you can use that as well.) >> Log Analytics workspace: Select your Workspace from the dropdown. If you don't have to create one.
- Click on "Save" to make the changes.
Step 7: Save & Wait for Logs
After saving the changes to get the logs in Log Analytics Workspace we have to wait for a least half an hour to collect logs.
Verify Your Diagnostic Settings
This step is for verification >>To check the logs go to Activity Logs for your select subscription. Do some kind of create, delete, update activity. To see the changes in the activity log.
- Perform a test action (e.g., delete a test resource group).
- Go to Log Analytics Workspace > Logs and run this query:
AzureActivity
| where OperationNameValue contains "DELETE"
You can check the activity logs of Operation Name, Status, Time, Subscription, and Event initiated by.
Best Practices for Azure Log Analytics
Azure Log Analytics is a robust service in Azure Monitor that allows you to gather, analyze, and take action on log data from sources such as virtual machines, applications, and cloud services.
- Retention: Log Analytics retains logs forever by default. Modify retention under workspace settings.
- Cost: Log storage has a cost. Keep an eye on usage in Azure Cost Management.
- Security: Limit access to Log Analytics to admins.
- Automation: Employ Azure Policy to apply diagnostics across subscriptions.
Conclusion
Configuring Diagnostic Settings in Azure is one of the simplest ways to enhance your cloud visibility, security, and operations control. It's not only about monitoring user activity or system events — it's about auditing readiness, incident investigation, compliance with industry regulations, and performance tuning.
By forwarding logs to a Log Analytics Workspace, you gain rich querying and dashboard functionality that enables you to drill down into your cloud activity with precision. From security notifications to policy violations, you'll always be aware of what's happening in your environment — and how to respond.
Explore
DevOps Basics
Version Control
CI & CD
Containerization
Orchestration
Infrastructure as Code (IaC)
Monitoring and Logging
Security in DevOps