

Power BI and Excel integration combine the data visualization and reporting capabilities of Power BI with the spreadsheet functionality of Excel. By linking the two users can analyze and manipulate Power BI data directly within Excel. This is vey useful tool for those who prefer working in Excel but still want the benefits of Power BI’s interactive visuals and data analysis.
Why Integrate Power BI with Excel
- Easy Data Access: You can pull your Power BI data into Excel at any time, so it's simpler to analyze and manipulate.
- Improved Customization: Excel gives you more flexibility with formulas and pivot tables, which may be helpful for deeper analysis or reporting.
- Refreshable Data: Connected Excel workbooks can refresh their Power BI data so users can work with updated information.
Working
Step 1: Open the Power BI Semantic Model
- Open the Power BI service and navigate to the report or semantic model that you want to analyze in Excel.
- If you are starting with a report, open the required report.
Step 2: Select Analyze in Excel
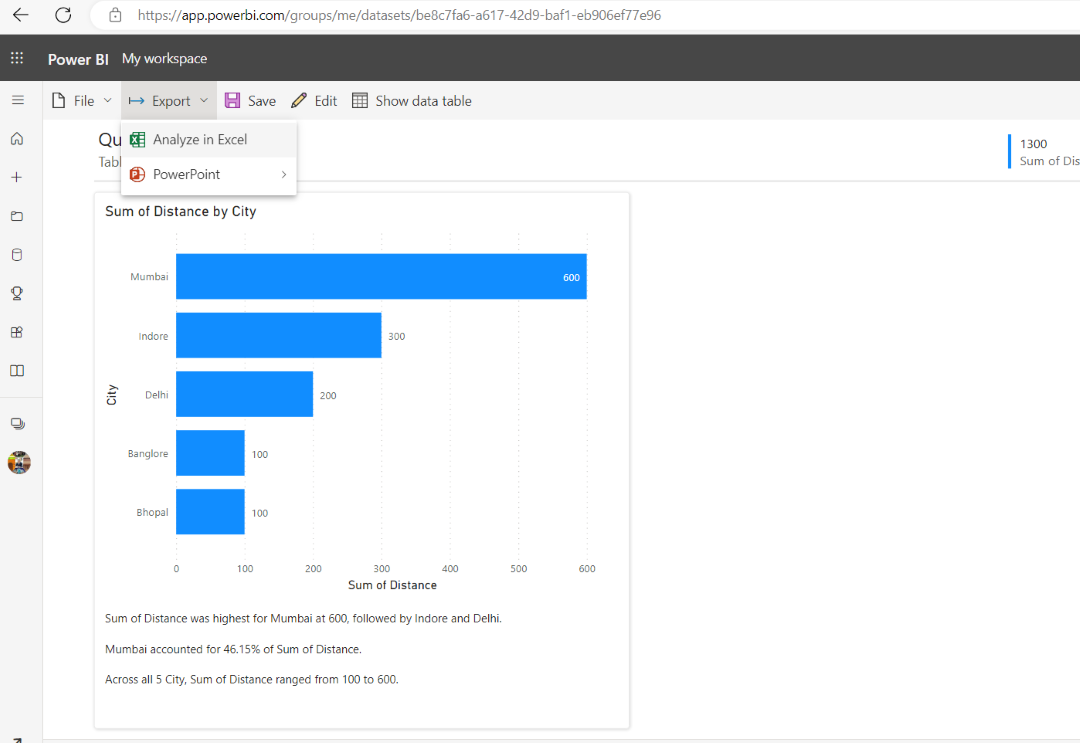
- From the Power BI service, select Export > Analyze in Excel.
- You can also select Analyze in Excel from the options available for a semantic model in a workspace.
- Power BI generates an Excel workbook containing a connection to the semantic model.
Step 3: Open the Excel Workbook
- After the workbook is generated, select Open in Excel for the web to open it in Excel for the web.
- If you have OneDrive or SharePoint available, Power BI can save the generated workbook there. Otherwise, the workbook can be downloaded to your computer.

Step 4: Enable the Power BI Connection
- When the workbook opens, Excel may display a Query and Refresh Data dialog.
- Select Yes to enable the connection to the Power BI semantic model.
- Once the connection is enabled, the tables and measures available from the Power BI semantic model can be used in Excel.
Step 5: Analyze the Data in Excel
- You can now analyze the connected Power BI data using Excel.
- For example, use the PivotTable Fields pane to add fields and measures to the PivotTable. You can organize data into rows, columns, values and filters to perform further analysis.
- Excel can also be used to create PivotCharts, filter data and perform additional calculations based on the connected data.
Step 6: Refresh the Data
- Because the workbook is connected to the Power BI semantic model, you can refresh the connected data in Excel when updated Power BI data is available.
- Use Excel's Refresh option to retrieve the latest available data from the connected semantic model.
- This allows the Excel analysis to remain connected to the centralized Power BI data rather than relying on a manually maintained copy.

Connecting to Power BI from Excel
Excel can also be used to start the connection.
- Open Excel.
- Go to the Data tab.
- Select Get Data > From Power BI.
- Search or browse for the required Power BI semantic model.
- Select the semantic model and connect to it.
- Use a PivotTable or connected table to analyze the data.
This provides another way to discover and work with Power BI semantic models directly from Excel.