Clustering is a fundamental technique in unsupervised learning, widely used for grouping data into clusters based on similarity. Among the clustering algorithms, K-Means and its improved version, K-Means++, are popular choices.
This article explores how both algorithms work, their advantages and limitations, and how K-Means++ addresses the shortcomings of K-Means to achieve better clustering results.
Understanding K-Means Algorithm
K-Means clusters similar data points by initially selecting a specific number of starting points, known as centroids, at random. Each data point is then assigned to the nearest centroid, and the centroids are updated to the average position of the points assigned to them. This process continues iteratively until the centroids no longer change position or a predefined number of iterations is completed.
Limitations of K-Means
- Random Initialization: Centroids are chosen randomly, which can lead to suboptimal clustering results.
- Sensitivity to Outliers: Outliers can significantly distort the centroid positions, reducing clustering accuracy.
- Predefined Number of Clusters: The number of clusters (K) must be specified in advance, which may not align with the actual data distribution.
- Shape and Size Assumptions: K-Means performs best with round and evenly sized clusters, making it unsuitable for irregularly shaped or unevenly distributed clusters.
Implementation of K-Means
Let’s implement K-Means on a synthetic dataset to observe its behavior.
import numpy as np
import matplotlib.pyplot as plt
import seaborn as sns
from sklearn.datasets import make_blobs

X, y = make_blobs(n_samples=600, centers=3, random_state=1000, cluster_std=1)

class KMeans:
    def __init__(self, n_clusters, init='k-means++', max_iter=300, tol=0.0001, random_state=None):
        self.n_clusters = n_clusters
        self.init = init
        self.max_iter = max_iter
        self.tol = tol
        self.random_state = random_state
        self.iteration_data = []

    def random_initialization(self):
        rng = np.random.RandomState(self.random_state)
        idxs = rng.choice(self.X.shape[0], size=self.n_clusters)
        return self.X[idxs]

    def initialization(self):
        if self.init == 'random':
            return self.random_initialization()
        elif self.init == 'k-means++':
            return self.kmeans_plus_plus_initialization()
    def visualize(self):
        n_plots = len(self.iteration_data)
        n_cols = 4
        n_rows = (n_plots + n_cols - 1) // n_cols

        fig, axes = plt.subplots(n_rows, n_cols, figsize=(12, 3 * n_rows))
        axes = axes.flatten()

        for i, data in enumerate(self.iteration_data):
            X, centroids, labels, itr = data
            sns.scatterplot(x=X[:, 0], y=X[:, 1], hue=labels, palette=['purple', 'orange', 'yellow'], ax=axes[i])
            axes[i].scatter(centroids[:, 0], centroids[:, 1], marker='o', color='black', s=150)
            axes[i].set_title(f'Iteration: {itr}')

        for ax in axes[len(self.iteration_data):]:
            ax.remove()

        plt.tight_layout()
        plt.show()

    def fit(self, X):
        self.X = X.copy()
        self.cluster_centers_ = self.initialization()

        for itr in range(self.max_iter):
            old_cluster_centers = self.cluster_centers_.copy()

            centroid_dist = np.linalg.norm((self.X[:, np.newaxis, :] - self.cluster_centers_[np.newaxis, :, :]), axis=-1)
            self.labels_ = np.argmin(centroid_dist, axis=-1)

            self.inertia_ = 0
            for idx in range(self.n_clusters):
                self.cluster_centers_[idx] = self.X[self.labels_ == idx].mean(axis=0)
                self.inertia_ += ((self.X[self.labels_ == idx] - self.cluster_centers_[idx][np.newaxis, :])**2).sum()

            centroids_change = old_cluster_centers - self.cluster_centers_
            if np.linalg.norm(centroids_change, ord='fro') >= self.tol:
                self.iteration_data.append((self.X, old_cluster_centers, self.labels_, itr + 1))

            if np.linalg.norm(centroids_change, ord='fro') < self.tol:
                print(f"Converged after {itr} iterations")
                break

        self.labels_ = self.predict(self.X)
        self.visualize()

    def predict(self, X):
        centroid_dist = np.linalg.norm((X[:, np.newaxis, :] - self.cluster_centers_[np.newaxis, :, :]), axis=-1)
        labels = np.argmin(centroid_dist, axis=-1)
        return labels

kmeans = KMeans(n_clusters=3, random_state=80, init='random')
kmeans.fit(X)
Output:
Converged after 7 iterations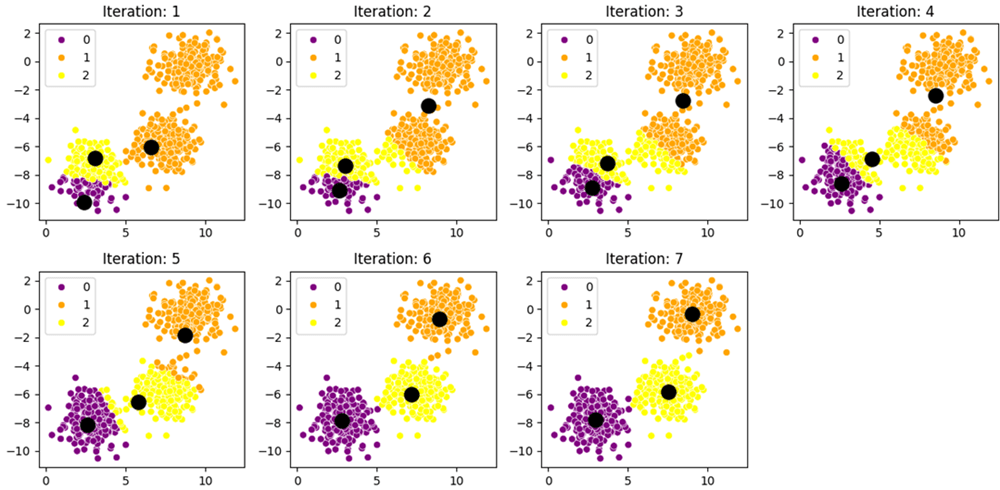
Random initialization can place centroids too close together, requiring more iterations and yielding suboptimal results.
What is K-Means++?
K-Means++ is an enhanced version of K-Means designed to address the issue of random centroid initialization. It uses a more systematic approach to select initial centroids, ensuring they are well-distributed across the dataset.
How K-Means++ Works
- Choose the First Centroid: Select the first centroid randomly from the data points.
- Select Subsequent Centroids:
- For each remaining centroid, calculate the squared distance of each data point to the nearest centroid.
- Assign a probability to each point based on its distance, with farther points having a higher chance of being selected.
- Select the next centroid based on this probability distribution.
- Repeat Until All K Centroids Are Chosen: Continue the process until all K centroids are initialized.
- Proceed with Standard K-Means: After initialization, the algorithm continues with the regular K-Means steps.
Advantages of K-Means++ Over K-Means
- Enhanced spread of centroids: By selecting centroids based on distance, K-Means++ helps ensure that they are placed more effectively, making it less likely that clusters will overlap or be poorly defined.
- Better Convergence: Since the initialization process in K-Means++ results in centroids being placed farther apart from each other and away from dense data areas, the algorithm tends to converge more quickly to a reasonable solution.
- Robustness: The improved initialization also makes K-Means++ more robust to datasets with varying densities, shapes, and sizes of clusters.
Implementation of K-Means++
Let’s implement K-Means++ on the same dataset to see its improved performance.
class KMeans:
    def __init__(self, n_clusters, init='k-means++', max_iter=300, tol=0.0001, random_state=None):
        self.n_clusters = n_clusters
        self.init = init
        self.max_iter = max_iter
        self.tol = tol
        self.random_state = random_state
        self.iteration_data = []

    def kmeans_plus_plus_initialization(self):
        rng = np.random.RandomState(self.random_state)
        idx_mask = np.zeros(shape=self.X.shape[0]).astype('bool')
        data_idxs = np.arange(self.X.shape[0])
        idx = rng.choice(data_idxs)
        idx_mask[idx] = True
        for _ in range(1, self.n_clusters):
            min_centroid_dist = (np.linalg.norm(
                self.X[~idx_mask, np.newaxis, :] - self.X[np.newaxis, idx_mask, :],
                axis=-1
            )**2).min(axis=-1)
            centroid_prob = min_centroid_dist / min_centroid_dist.sum()
            idx = rng.choice(data_idxs[~idx_mask], p=centroid_prob)
            idx_mask[idx] = True
        return self.X[idx_mask]
    def initialization(self):
        if self.init == 'random':
            return self.random_initialization()
        elif self.init == 'k-means++':
            return self.kmeans_plus_plus_initialization()
    def visualize(self):
        n_plots = len(self.iteration_data)
        n_cols = 4
        n_rows = (n_plots + n_cols - 1) // n_cols

        fig, axes = plt.subplots(n_rows, n_cols, figsize=(12, 3 * n_rows))
        axes = axes.flatten()

        for i, data in enumerate(self.iteration_data):
            X, centroids, labels, itr = data
            sns.scatterplot(x=X[:, 0], y=X[:, 1], hue=labels, palette=['purple', 'orange', 'yellow'], ax=axes[i])
            axes[i].scatter(centroids[:, 0], centroids[:, 1], marker='o', color='black', s=150)
            axes[i].set_title(f'Iteration: {itr}')

        for ax in axes[len(self.iteration_data):]:
            ax.remove()

        plt.tight_layout()
        plt.show()

    def fit(self, X):
        self.X = X.copy()
        self.cluster_centers_ = self.initialization()

        for itr in range(self.max_iter):
            old_cluster_centers = self.cluster_centers_.copy()

            centroid_dist = np.linalg.norm((self.X[:, np.newaxis, :] - self.cluster_centers_[np.newaxis, :, :]), axis=-1)
            self.labels_ = np.argmin(centroid_dist, axis=-1)

            self.inertia_ = 0
            for idx in range(self.n_clusters):
                self.cluster_centers_[idx] = self.X[self.labels_ == idx].mean(axis=0)
                self.inertia_ += ((self.X[self.labels_ == idx] - self.cluster_centers_[idx][np.newaxis, :])**2).sum()

            centroids_change = old_cluster_centers - self.cluster_centers_
            if np.linalg.norm(centroids_change, ord='fro') >= self.tol:
                self.iteration_data.append((self.X, old_cluster_centers, self.labels_, itr + 1))

            if np.linalg.norm(centroids_change, ord='fro') < self.tol:
                print(f"Converged after {itr} iterations")
                break

        self.labels_ = self.predict(self.X)
        self.visualize()

    def predict(self, X):
        centroid_dist = np.linalg.norm((X[:, np.newaxis, :] - self.cluster_centers_[np.newaxis, :, :]), axis=-1)
        labels = np.argmin(centroid_dist, axis=-1)
        return labels

kmeans_plus_plus = KMeans(n_clusters=3, random_state=80)
kmeans_plus_plus.fit(X)
Output:
Converged after 4 iterations
K-Means++ method gives better results compared to the random method of K-Means. The K-Means++ method spreads the starting points farther apart which helps the algorithm work faster and find good clusters more quickly.
Difference Between K-Means and K-Means++ in Tabular Form
K-Means | K-Means++ | |
|---|---|---|
Centroid Initialization | Randomly selects initial centroids | Strategically selects well-spread initial centroids |
Cluster Quality | Depends on random initialization, may be suboptimal | Generally produces better clusters due to better starting points |
Convergence Speed | May converge more slowly | Faster convergence due to improved initialization |
Initialization Time | Quick and simple | Slightly slower due to additional calculations |
Risk of Poor Clustering | Higher due to random starting points | Lower due to systematic initialization |
Algorithm Complexity | Simpler and faster in initialization | Slightly more complex due to extra initialization step |
Both K-Means and K-Means++ are valuable clustering algorithms, but K-Means++ significantly improves upon K-Means by addressing the limitations of random initialization. Its systematic approach leads to faster convergence, fewer iterations, and more accurate clustering results. While K-Means may be preferred for simplicity and speed in initialization, K-Means++ is the better choice for practical applications requiring robust and high-quality clustering.