Outliers are data points that differ significantly from the rest of the dataset and do not follow the general pattern. They can occur due to errors, rare events or natural variability in data.
- Appear as unusually high or low values
- Can affect mean, variance, and model performance
- Detected using statistical and visual methods
- Important to analyze before removing or treating them
Why Outliers Occur
Outliers can occur due to a variety of reasons. Identifying their source is crucial for accurate data analysis
- Data Entry Errors: Mistakes made while entering data manually can generate extreme or inconsistent values.
- Measurement Errors: Faulty instruments or incorrect experimental setups can lead to abnormally high or low readings.
- Experimental Errors: Poorly designed experiments may produce results that do not accurately represent the underlying phenomenon.
- Intentional Outliers: Sometimes outliers are introduced deliberately such as in cases of fraud or data manipulation.
- Data Processing Errors: Errors during data collection, cleaning or transformation can introduce unusual values.
- Natural Variation: Some outliers arise naturally due to inherent variability in the population or process being studied.
Why Removing Outliers Is Necessary
Impact on Analysis
- Outliers can heavily distort statistical measures like the mean, variance and correlation leading to biased or misleading results.
- Removing extreme values helps the analysis represent the central trend and typical behavior of the dataset more accurately.
Statistical Validity
- Outliers can weaken the reliability of hypothesis testing and reduce the performance of predictive models.
- Proper handling of outliers improves model stability, accuracy and the trustworthiness of statistical conclusions.
Model Performance and Interpretability
- Outliers may cause machine learning models to overfit or learn incorrect patterns from rare extreme values.
- Eliminating irrelevant outliers makes models easier to interpret and enhances their generalization to new data.
Types of Outliers
Outliers can appear in various forms depending on how they deviate from the data and the context in which they occur. Each type presents distinct challenges for detection and interpretation.
1. Univariate Outliers
Univariate outliers are extreme values in a single variable that differ significantly from the rest of the data. For example in a dataset of adult heights where most values range between 5.5 and 6 feet, a height of 7 feet would be considered a univariate outlier.
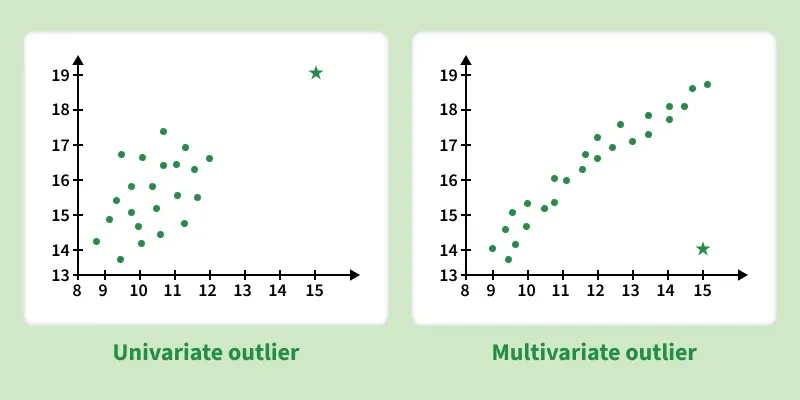
2. Multivariate Outliers
Multivariate outliers involve unusual combinations of values across multiple variables. For instance when analyzing both height and weight an individual who is exceptionally tall and unusually heavy compared to others may be considered a multivariate outlier, even if each value alone appears reasonable.
3. Point (Global) Outliers
Point outliers also known as global outliers are individual data points that lie far away from the majority of observations in the dataset. These are the simplest type of outliers and are commonly targeted by most detection methods. For example, extremely high household energy consumption compared to others may indicate a global outlier.

4. Contextual (Conditional) Outliers
Contextual outliers are data points that appear abnormal only under specific conditions or contexts. For example, a very low temperature may be normal during winter but considered an outlier in summer. These outliers depend on contextual attributes such as time, location or environmental conditions.

Contextual outlier detection considers both contextual attributes (e.g., season, time, location) and behavioral attributes (e.g., temperature, humidity, pressure). This approach allows for flexible and meaningful outlier detection across varying conditions.
5. Collective Outliers
Collective outliers occur when a group of data points collectively deviates from normal behavior, even if individual points are not extreme on their own. This type often indicates a shift in data patterns or emerging phenomena, such as a sudden sequence of unusual network activities.

Techniques for Outlier Detection
Outlier detection is an essential step in data analysis as it helps identify abnormal observations that may arise due to measurement errors, data entry mistakes or genuine rare events. These unusual values can significantly influence statistical results and model performance, making their identification critical before further analysis.
1. Outlier Identification Using Visualization Techniques
Visualization based methods provide an intuitive understanding of data distribution and allow analysts to easily spot extreme or abnormal values.
A. Identifying Outliers Using Box Plots
Box plots visually summarize the distribution of a dataset using the median, quartiles and interquartile range (IQR). Any data points lying beyond the whiskers typically defined as 1.5 times the IQR from the first or third quartile are considered potential outliers.
This method is especially effective for quickly identifying extreme values in a single variable.
import pandas as pd
import seaborn as sns
import matplotlib.pyplot as plt

data = {"IQ": [95, 102, 98, 110, 105, 99, 101, 97, 150, 72]}
df = pd.DataFrame(data)

sns.boxplot(x=df["IQ"])
plt.title("Box Plot for IQ Data")
plt.show()
Output:
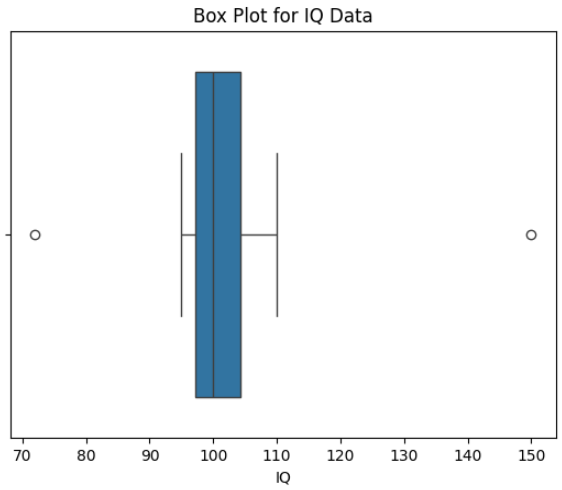
The box plot shows outliers as points beyond the whiskers, with 72 and 150 indicating unusually low and high IQ values.
B. Identifying Outliers Using Scatter Plots
Scatter plots serve as vital tools in figuring out outliers inside datasets mainly when exploring relationships between two non-stop variables. These visualizations plot person facts points as dots on a graph, with one variable represented on each axis.
Outliers in scatter plots often take place as factors that deviate extensively from the overall sample or fashion discovered most of the majority of statistics factors.
plt.scatter(df.index, df["IQ"])
plt.xlabel("Index")
plt.ylabel("IQ")
plt.title("Scatter Plot for IQ Data")
plt.show()
Output:
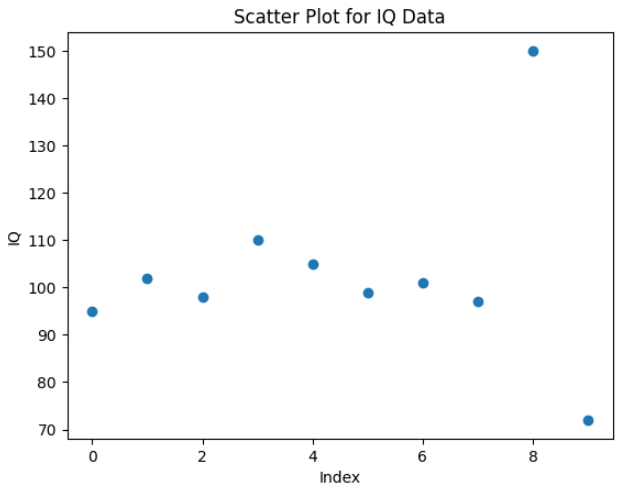
This scatter plot shows most IQ values clustered around 95–110 while the points near 72 and 150 stand out clearly as outliers compared to the rest of the data.
2. Outlier Identification Using Statistical Methods
Statistical methods identify outliers by measuring how far data points deviate from the overall distribution using mathematical thresholds.
A. Identifying Outliers Using Z-Score
The Z-score method measures how many standard deviations a data point is from the mean of the dataset. Values with Z-scores greater than +3 or less than −3 are commonly treated as outliers making this approach suitable for normally distributed data.
import pandas as pd
import numpy as np
from scipy.stats import zscore

np.random.seed(0)
normal_iq = np.random.normal(100, 5, 100)
outliers = [30, 250]

iq_data = np.concatenate([normal_iq, outliers])

df = pd.DataFrame({"IQ": iq_data})
df["Z_Score"] = zscore(df["IQ"])

outliers_z = df[np.abs(df["Z_Score"]) > 3]
print(outliers_z)
Output:

The output shows that IQ values 30 and 250 lie far from the mean with Z-scores beyond
B. Identifying Outliers Using the IQR Method
The IQR method defines outliers as values that fall below Q1 − 1.5 × IQR or above Q3 + 1.5 × IQR. Since it does not assume a normal distribution this technique is robust and widely used in real-world datasets.
Q1 = df["IQ"].quantile(0.25)
Q3 = df["IQ"].quantile(0.75)
IQR = Q3 - Q1

lower_bound = Q1 - 1.5 * IQR
upper_bound = Q3 + 1.5 * IQR

outliers_iqr = df.query("IQ < @lower_bound or IQ > @upper_bound")
print(outliers_iqr)
Output:
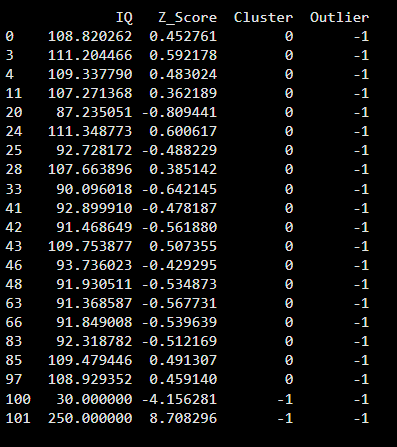
C. Identifying Outliers Using DBSCAN
DBSCAN detects outliers by grouping dense regions of data and labeling points that do not belong to any cluster as noise. This density-based approach is effective for datasets with irregular shapes and varying densities.
from sklearn.cluster import DBSCAN

dbscan = DBSCAN(eps=5, min_samples=2)
df["Cluster"] = dbscan.fit_predict(df[["IQ"]])

outliers_dbscan = df[df["Cluster"] == -1]
print(outliers_dbscan)
Output:

This output shows that IQ values 30 and 250 are labeled as noise (Cluster = −1) by DBSCAN,
D. Identifying Outliers Using Isolation Forest
Isolation Forest detects outliers by isolating data points using random decision trees. Anomalies are separated with fewer splits because they are rare and different from normal data. This makes the method fast, scalable, and effective for high-dimensional datasets.
from sklearn.ensemble import IsolationForest

iso = IsolationForest(contamination=0.2, random_state=42)
df["Outlier"] = iso.fit_predict(df[["IQ"]])

outliers_iso = df[df["Outlier"] == -1]
print(outliers_iso)
Output:
This output shows that Isolation Forest flags the most unusual IQ values as outliers (Outlier = −1) by isolating them from the normal data distribution
You can download full code from here
How to Handle Outliers in Data
Once outliers are detected the next step is deciding how to handle them. The approach depends on the cause of the outlier, the size of the dataset and the goal of the analysis. Common strategies include:
Removal (Trimming)
- Outliers can be removed entirely if they are clearly errors or irrelevant to the analysis.
- Care must be taken removing too many points may distort the data distribution and reduce the dataset representativeness.
- Best suited for large datasets where a small number of extreme values won’t significantly affect overall results.
Capping or Flooring (Quantile-Based Treatment)
- Outliers can be replaced with upper and lower bounds.
- Values above the upper bound are capped at the threshold values below the lower bound are floored.
- This method preserves all data points while reducing the influence of extreme values.
- Best suited for numeric features with long-tailed distributions.
Mean/Median Imputation
- Outliers can be replaced with a central measure such as the mean or median of the data.
- Median imputation is preferred because it is less affected by extreme values compared to the mean.
- This method keeps the dataset size intact while mitigating the impact of outliers.
- Best suited for datasets where outliers are rare and likely due to errors.
Transformation
Transforming data can reduce the impact of extreme values. Common transformations include:
- Logarithmic transformation: Useful when data spans multiple orders of magnitude.
- Box-Cox transformation: Converts skewed data to a more normal distribution.
This method is useful when preserving all data points is important but their influence needs moderation.
When to Drop or Keep Outliers
Dropping outliers should be done cautiously and only when there is clear evidence that they result from errors rather than real observations. While some outliers arise from data entry or measurement mistakes others represent meaningful rare events so their cause must be carefully examined before removal.
When You Should Drop Outliers
- When the value is clearly incorrect: If domain knowledge confirms that a value is impossible (e.g. a human age of 200 years) it can safely be removed.
- When you have a large dataset: In large samples removing a small number of questionable outliers usually does not distort the overall data distribution.
- When verification is possible: If you can revisit the data source and confirm that the observation resulted from an error removal is justified.
When You Should Not Drop Outliers
- When results are critical or high-risk: In safety-critical or scientific applications (e.g. aircraft system failures or medical data) even extreme values may carry crucial information.
- When many outliers are present: If a large portion of the dataset appears as outliers it likely indicates an underlying pattern, data shift or segmentation issue that requires deeper analysis rather than removal.
- When outliers represent real phenomena: In domains like fraud detection, anomaly detection or rare event modeling outliers are often the primary focus and should be retained.