Bivariate analysis is a statistical method used to explore the relationship between two variables. The goal is to understand whether and how the two variables are related — and if they are, then describe the nature, strength, and direction of that relationship.
It is a quantitative analysis that examines two variables denoted as X and Y. Bivariate analysis aims to understand to what extent one variable (possibly independent) predicts the value of another (possibly dependent). It helps uncover correlations and associations between different factors in data analysis.
For instance, consider a study examining the relationship between exercise duration (X) and heart rate (Y) during physical activity. By analyzing this bivariate data, we can determine if there's a correlation between the duration of exercise (independent) and heart rate(dependent).
Example:
A teacher collected data of total hours studied by students and total marks scored by them:
Total Hours Studied in a Week
Marks scored out of 700
14
450
12
413
20
490
22
566
24
576
29
640
13
340
The teacher can determine the correlation between the two variables, which is 0.926.
This shows that the two variables have a very strong positive association.
In other words, the marks scored by a student in a test is directly correlated to number of hours studied by him/her.
In this article, we will dive into bivariate analysis in depth.
Types of Bivariate Analysis
The type of bivariate analysis used depends on the nature of the variables involved — whether they are numerical, categorical, or ordinal. The choice of statistical technique is guided by how these variables interact.
1) Numerical Vs Numerical:
In this type, both the independent and dependent variables are numerical.
- Height vs. Weight – Do taller people tend to weigh more?
- Study Hours vs. Test Scores – Is there a relationship between time spent studying and performance?
2) Categorical vs Categorical:
Here, both variables are categorical. The goal is often to test for association or independence.
- Gender vs. Product Preference – Do preferences vary between male and female customers?
3) Numerical vs Categorical:
In this scenario, one variable is numerical (usually the dependent), and the other is categorical (often the independent).
- Education Level vs. Income – How does education level impact salary?
Types of Bivariate Analysis Methods
The various types of methods used in bivariate analysis are:
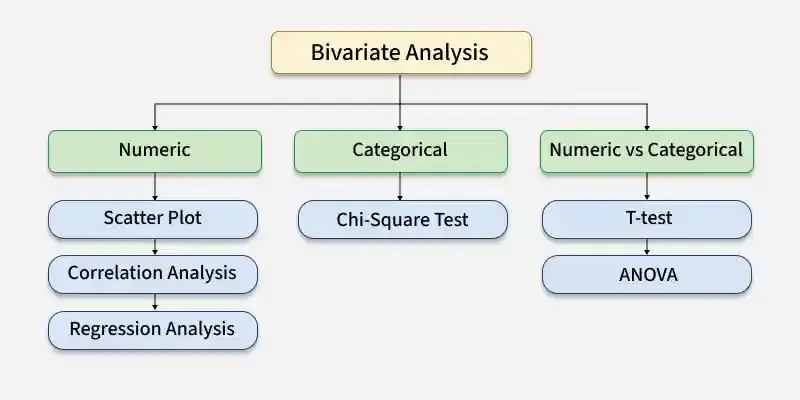
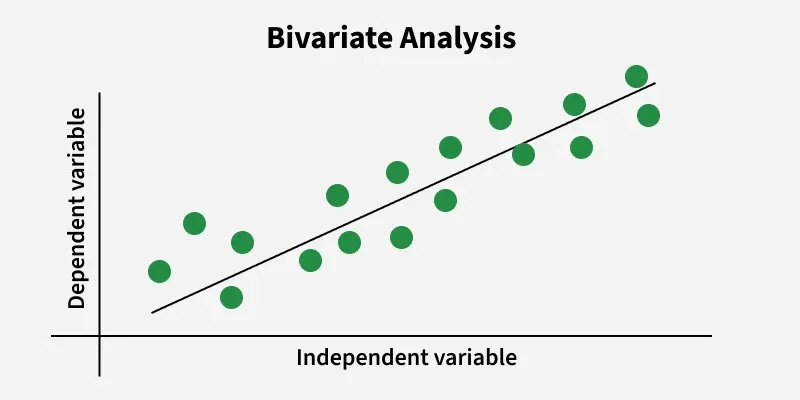
Scatter Plots
Scatter Plots visually display the relationship between two variables. Each dot on the plot represents a single observation, (xi, yi). The pattern formed by the dots can reveal the nature of the relationship between the variables—whether it's positive, negative, or no correlation.
- Positive Trend: Points slope upward (e.g., height vs. weight).
- Negative Trend: Points slope downward (e.g., TV time vs. grades).
- No Pattern: Random cloud (e.g., shoe size vs. IQ).
.webp)
Correlation Analysis
Correlation Analysis quantifies the strength and direction of the relationship between two continuous variables.
- The correlation coefficient, typically denoted by "r," ranges from -1 to 1.
- A positive value indicates a positive correlation (as one variable increases, the other tends to increase), while a negative value suggests a negative correlation (as one variable increases, the other tends to decrease).
- A value close to zero indicates little to no correlation.
Regression Analysis
Regression analysis explores the relationship between two or more variables by predicting one variable (the dependent variable) based on the values of one or more other variables (the independent variables).
- Simple linear regression involves predicting a dependent variable from a single independent variable, while multiple linear regression involves predicting the dependent variable from multiple independent variables.
Chi-Square Test
The chi-square test examines the association between two categorical variables by comparing the observed frequencies in a contingency table to the frequencies that would be expected if the variables were independent.
- It determines whether the observed association between the variables is statistically significant or due to random chance.
T-tests and ANOVA
T-tests and analysis of variance (ANOVA) are used to compare means between groups for one or more independent variables. In bivariate analysis, they can be applied to examine whether there are significant differences in the mean values of a continuous variable across different categories of another variable.
- T-tests are suitable for comparing means between two groups, while ANOVA is used for comparing means among three or more groups.
Univariate vs Bivariate vs Multivariate Analysis
The basic difference between univariate, bivariate, and multivariate analysis is explained in the table added below:
Univariate Analysis | Bivariate Analysis | Multivariate Analysis |
|---|---|---|
Univariate analysis involves the analysis of a single variable. This helps to describe and summarize the characteristics and distribution of that variable. | Bivariate analysis involves the analysis of the relationship between two variables. This helps to examine how one variable behaves about another. | Multivariate analysis involves the simultaneous analysis of three or more variables. This helps to examine the complex relationships between multiple variables. |
Techniques used in univariate analysis include:
| Techniques used in bivariate analysis include
| Common techniques used in multivariate analysis include:
|
Univariate analysis is useful for understanding the basic properties of a variable and identifying any outliers or patterns within it. | Bivariate analysis helps in understanding the strength and direction of the relationship between two variables. It is particularly useful for identifying associations or dependencies between variables. | Multivariate analysis allows for the exploration of interactions and dependencies among multiple variables. It helps in understanding the combined effect of several variables on an outcome or in identifying latent structures within the data. |
Applications of Bivariate Analysis in CS
Some of the applications of bivariate analysis in computer science are given below:
Machine Learning and Data Processing
- Correlation Analysis between features helps in feature selection and dimensionality reduction.
- For example, to identify multicollinearity, understand linear or non-linear relationships between variables, and detect redundant features.
Software Engineering
- Analyzing defect rates vs. code metrics helps understand software quality
- For example, the relationship between code complexity and the number of maintenance hours.
Network and System Performance Analysis
- Evaluating the relationship between bandwidth and latency, or CPU usage vs. response time, helps in performance tuning.
- Used in benchmarking and optimizing system resources.
Human-Computer Interaction (HCI)
- Understanding user behavior by analyzing two variables, such as Time on task vs. number of errors, and Click frequency vs. page load time.
- Helps improve interface design and user experience.
Natural Language Processing (NLP)
- Analyzing relationships between word frequency and document relevance, or word count and sentiment score.
- Important in preprocessing and feature engineering for models like sentiment classifiers.