Data modeling is the process of identifying, organizing and defining the types of data a business collects and the relationships between them. It uses diagrams, symbols and textual definitions to visually represent how data is captured, stored and used. A well-designed data model helps:
- Understand data requirements
- Ensure proper structure for reporting
- Align with business goals
- Maintain data integrity
Power BI Interface and Data Loading
1. Power BI Workspace
Power BI Desktop is the development environment where users create reports, transform data and build data models. It includes views such as Report, Data and Model for analysis and visualization. Workspaces are a feature of Power BI Service (cloud platform), where users can publish, share and collaborate on reports and dashboards.

2. Power BI Desktop Panes
Power BI Desktop includes three main panes: Report, Visualizations and Data. The Report pane displays visuals created using fields from the Data pane while the Visualizations pane allows users to select and customize chart types.

3. Data Pane Overview
After loading a data source such as an Excel file the Data pane on the right side displays tables and fields available for reporting and analysis.

4. Connecting to Data Sources
Power BI allows users to extract data from one or multiple sources. Supported sources include Excel, CSV/Text, XML, JSON, Oracle databases, Azure SQL databases, cloud-based services and more.

5. Selecting Data Source Type
Users can choose the required data source based on availability and business needs such as Excel files, CSV files, databases or online cloud sources.

6. Data Loading and Transformation
Once a data source is selected the Navigator window helps users preview, transform and load data into Power BI for further modeling and analysis.

Understanding Relationships in Data Modeling
Relationships are the main feature of data modelling defining all data types. Relationships helps connect with multiple data sources using Cardinality. The following image shows that we have different panes for Data, Properties, Visualizations and Reports.

Data visualizations on multiple data source by analyzing data and defining relationships between them.

You can also define data type, explain the usage of data, manage data, define data needs, remove redundant data ( data integrity ), retrieve data and perform data analytics, track key performance indicators and provide useful solutions for business.
Data view in Power BI
- The Data view in Power BI Desktop displays the contents of your selected data source such as an Excel file. This view allows users to explore tables, columns and individual records, providing a clear understanding of the dataset before creating relationships or reports.

- Defining relationships between data attributes in your model enables deeper insights and supports effective data storytelling allowing access to related data across multiple sources

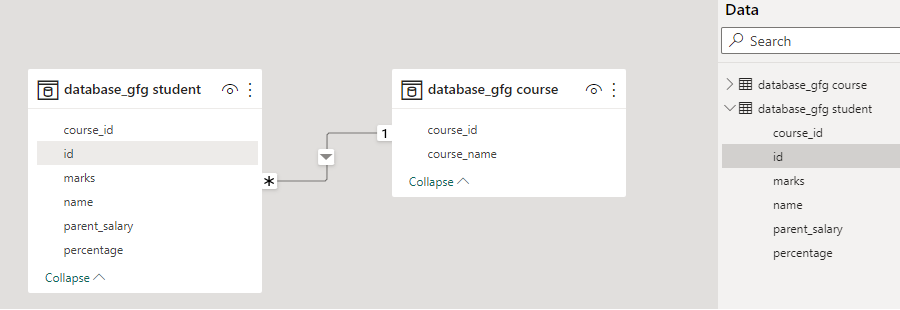
Model View in Power BI
The Model view displays tables, their attributes and the relationships between them which are essential for accurate report generation. The image below shows the Model view for a selected dataset.

Report View in Power BI
The Report view allows users to create detailed reports with features such as filters, drill-downs and cross-report interactions. Users can select multiple parameters for analysis based on requirements, enabling customized and interactive data exploration.

- Filter options: Power BI provides various filtering options to refine and customize reports. The image below shows the Filters pane in Power BI Desktop.

- Sorting: Users can apply search and sort filters to organize data in reports according to specific requirements.

- Power BI autodetect feature: After loading all the tables still no relationship can be seen between tables then the Autodetect tool can be used to detect any relationship or connection.

- Modelling Feature in Power BI: There is also an option of creating and modelling relationships between table manually.

Create relationships in Power BI
Managing and editing table relationships refers to the process of defining and maintaining the connections between tables in a relational database. Table relationships are important for maintaining data integrity and ensuring efficient data retrieval. The below image shows a example showing the editing of relationship between tables and its support for cardinality.

1. Many to one: This means that the column in a given table can have more than one instance of a value while the other table will only have one instance of the value.
2. One to one: This means that the column in one table has only one instance of value and the other table also has one instance of value.

3. One to many: In one-to-many relationship, the column in the given table has one instance of value while as the other related table can have more than one instance of value.

4. Many to many: This type of relationship is when a column in both tables has duplicate values.
Cross filter direction: Power BI also supports directionality. This option determines the direction of cross-filtering to be utilized for a two-column relation. DAX is a formula and query language that is designed to work with tabular data models and is primarily used to simplify data analysis and calculation tasks in Power BI.
![]()
More Feature of Power BI
Query Editor in Power BI is used to edit or format the data files before they are loaded into the Power BI Model. The Query Editor plays the role of an intermediate data container where you can modify data type or the way the data is stored by selecting the particular rows and columns.
