

Power BI is a data visualization and business intelligence tool developed by Microsoft. It helps users connect to, transform, analyze and visualize data through interactive reports and dashboards.
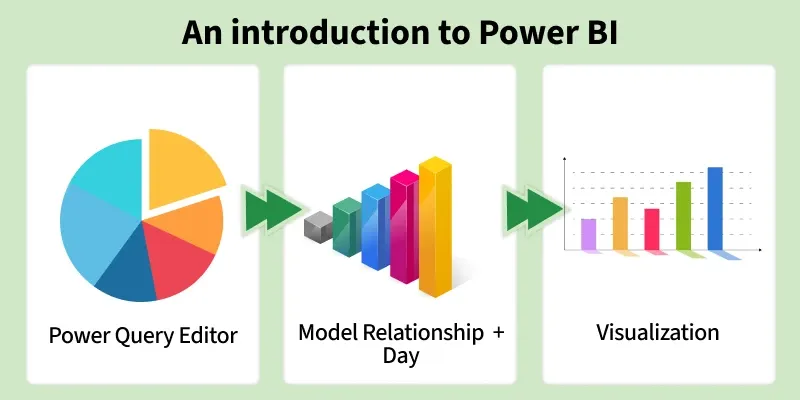
- Interactive Reporting: Creates dynamic reports and dashboards that allow users to explore data.
- Data Analysis: Helps identify trends, patterns and relationships in data.
- Data Integration: Brings data from multiple sources into a single environment for analysis.
- Business Intelligence: Turns data into actionable insights that support business operations and planning.
Need for Power BI
Organizations often work with large amounts of data spread across different sources, making it difficult to analyze and monitor information efficiently. Power BI addresses these challenges by providing a centralized platform for data analysis and reporting.
- Centralized Analysis: Combines data from different sources into a single view for easier analysis.
- Faster Reporting: Reduces manual effort involved in preparing and updating reports.
- Data Monitoring: Helps track changing data and key metrics through regularly refreshed or real-time reports.
- Self-Service Analytics: Allows users to explore data and create reports without extensive programming knowledge.
- Scalable Reporting: Supports individual users as well as organizations with large-scale reporting and data needs.
Key Components
Power BI consists of several components, each serving a specific role in the data analysis and reporting process:
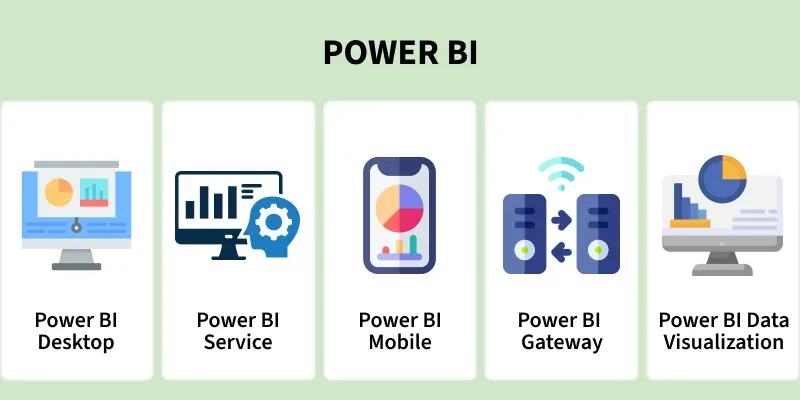
- Power BI Desktop: A free application installed on your computer that allows you to connect to data, clean it and create interactive reports.
- Power BI Service: The cloud-based version where you can publish, share and access reports and dashboards from anywhere.
- Power BI Mobile: Mobile apps for iOS and Android that let you view and interact with reports on smartphones and tablets.
- Power BI Gateway: Acts as a bridge between on-premises data sources and Microsoft cloud services such as Power BI, allowing data to be refreshed or accessed securely.
- Power BI Report Server: An on-premises reporting platform that allows organizations to publish and manage Power BI reports within their own infrastructure.
- Power BI Embedded: Allows developers to embed Power BI analytics and reports into applications and websites, enabling users to access insights within the application.
How to Use Power BI
Getting started with Power BI is simple. Follow these steps to create insightful reports and dashboards.
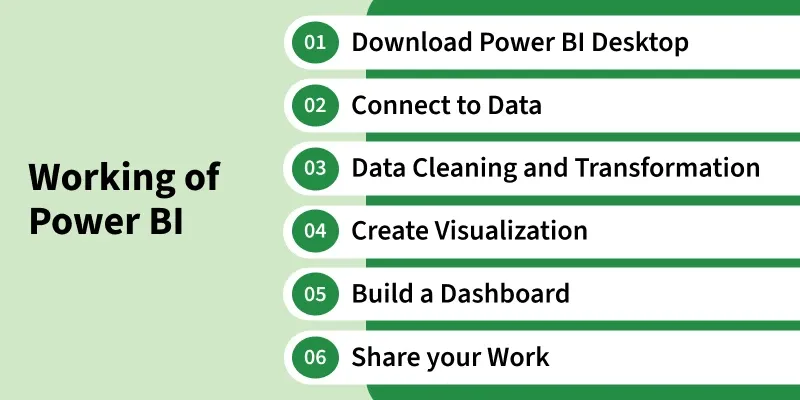
Step 1: Download Power BI Desktop
- Download Power BI Desktop for free from the Microsoft website.
- Install it on your Windows system to start creating reports.
- Provides a clean and easy-to-use workspace.
Step 2: Connect to Your Data
- Click Get Data to connect to Excel, SQL databases or cloud sources.
- Import data from multiple sources into one report.
- Follow simple on-screen steps to load your data.
Step 3: Clean & Transform Data
- Use Power Query to clean and prepare your data.
- Remove unnecessary data and fix data types.
- Ensure accurate and reliable analysis.
Step 4: Build the Data Model
- Create relationships between related tables.
- Organize tables into a suitable data model.
- Add calculated columns and measures when required.
- Ensure the model is structured for efficient analysis.
Step 5: Create Visualizations & Reports
- Drag and drop fields to create charts, tables, cards and other visuals.
- Use filters and slicers to make reports interactive.
- Arrange visuals to present important metrics and insights clearly.
Step 6: Publish and Share
- Publish the report to Power BI Service.
- Share reports or dashboards with users based on permissions.
- Configure scheduled refresh when required.
Tips for Using Power BI Effectively
- Learn DAX: Use DAX to create measures and perform advanced calculations.
- Master Power Query: Use Power Query to efficiently clean and transform data before loading it into the model.
- Build Efficient Data Models: Use appropriate relationships and a well-structured model for better performance and easier analysis.
- Keep Reports Organized: Use meaningful names for tables, fields, measures and reports.
- Use Templates: Use templates to speed up report development and maintain consistent designs.
For a complete guide to Power BI, refer to this Power BI Tutorial