Power Query Editor in Power BI is used to connect, clean and transform data before loading it into a report. It provides a range of tools for reshaping data, changing data types, removing unwanted values and combining or splitting columns.
Launching Power Query Editor
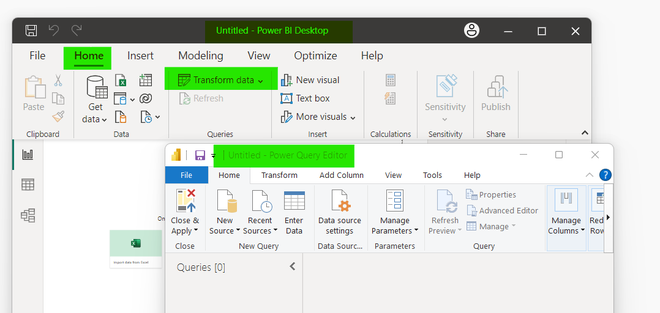
In Power BI Desktop, go to the Home tab and click Transform Data. This opens the Power Query Editor, where you can connect to data sources and apply transformations before loading the data into Power BI.
Importing Data
- In Power Query Editor, click New Source to connect to a data source such as Excel, SQL Server or the web.
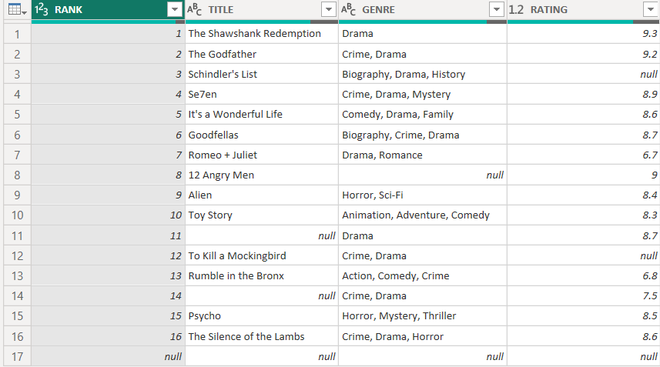
- For example, we use an Excel file named My movie list.xlsx. After loading the file, its data appears in Power Query Editor as shown below.

On loading this data on the query editor it appears as:
Data Transformations
1. Renaming Elements
The power query editor provides us with a variety of possible renaming. We can rename the data sources or tables, columns and queries. We will look into each of them one by one.
Rename Query
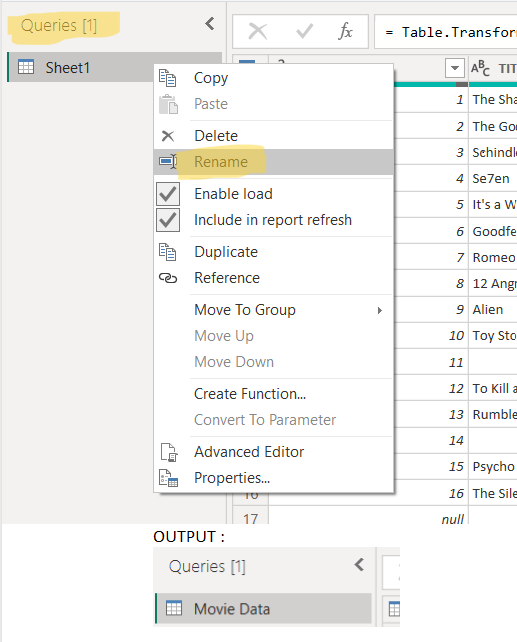
- You can rename a query from the Queries pane by right clicking it and selecting Rename.
- For example, the query is renamed from Sheet1 to Movie Data.
Rename Column
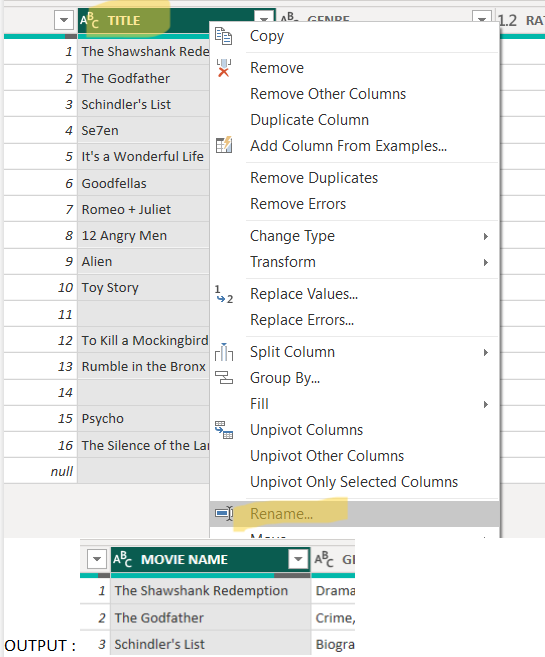
- To rename a column, right-click its name and select Rename, then enter the new name.
- For example, the TITLE column is renamed to MOVIE NAME.
2. Make First Row as Headers
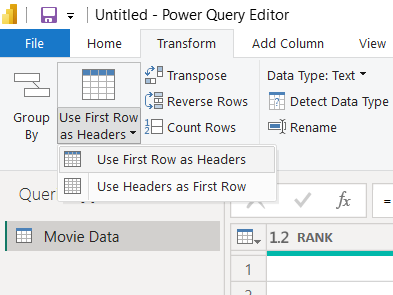
- The Use First Row as Headers option promotes the first row of a table to column headers. It is available under the Transform tab.
- The Use Headers as First Row option can be used to reverse the operation.
3. Change Data Types of a Column
- Power Query allows you to change a column's data type, such as from Whole Number to Decimal Number, Text, Date or Date/Time.
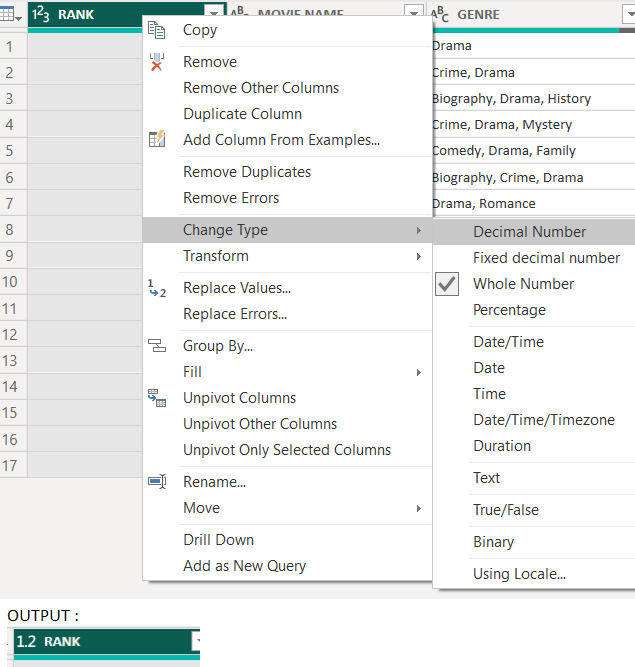
- To change a data type, right-click the column, select Change Type and choose the required type. You can also change it from the Home tab.
- For example, the RANK column is changed from Whole Number to Decimal Number.
4. Format Text in Power Query
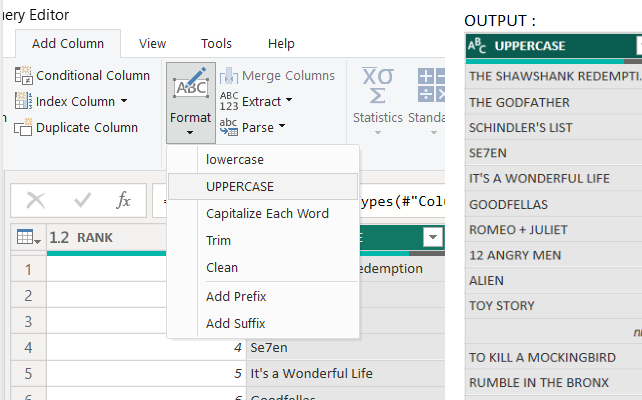
The Format option under the Transform tab can be used to clean and modify text values. Common options include:
- Change Case: Converts text to uppercase, lowercase or proper case.
- Add Prefix/Suffix: Adds text before or after existing values.
- Trim: Removes leading and trailing spaces.
- Clean: Removes non-printable characters.
5. Remove Rows & Columns
Remove Rows
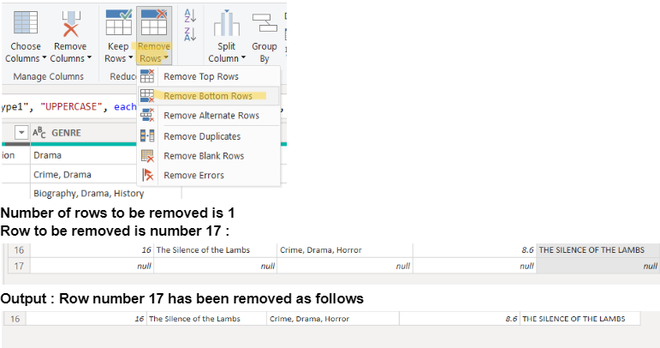
- The Remove Rows option under the Home tab allows you to remove unwanted rows from a table. You can remove top, bottom, alternate, duplicate, blank or error rows.
- You can also use Keep Rows to retain only the required rows.
Remove Columns
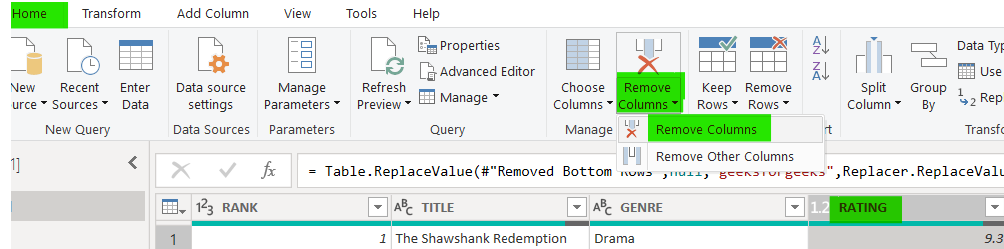
- The Remove Columns option allows you to delete selected columns. You can also select Remove Other Columns to keep only the selected columns.
- For example, removing the RATING column deletes it from the table.
Output:

6. Merge Columns
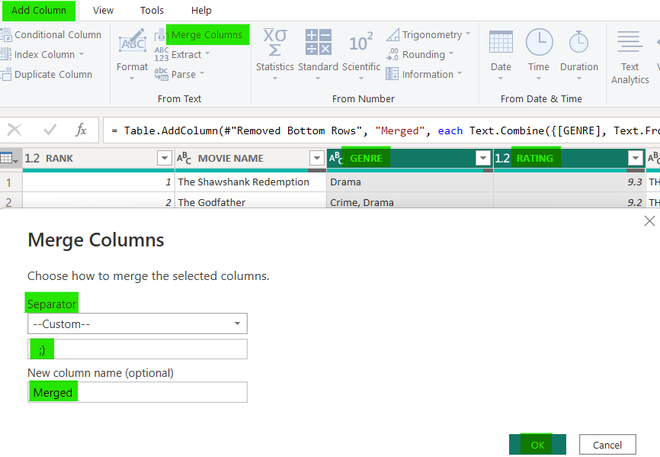
The Merge Columns feature combines values from two or more columns into a single column. It is available under the Transform tab. To merge columns:
- Select the columns to combine while holding Ctrl.
- Click Merge Columns.
- Choose a separator, such as a space, comma or custom character.
- Enter a name for the new column.
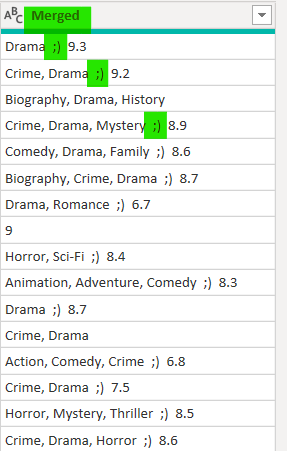
For example, the GENRE and RATING columns are merged into a new column named Merged.
Output:
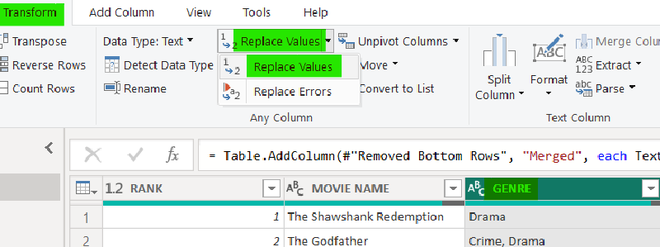
7. Replace Values
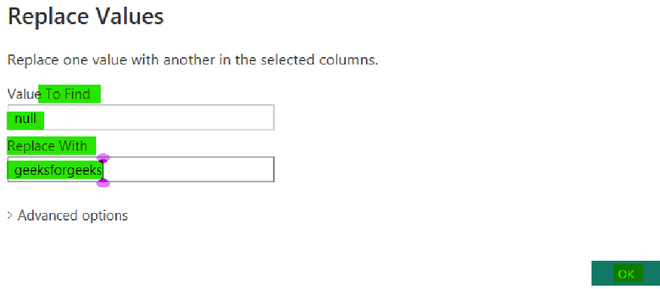
- The Replace Values option replaces an existing value with another value. It is available under the Transform tab.
- For example, missing values in the GENRE column can be replaced with Unknown.
Output:

8. Split Column
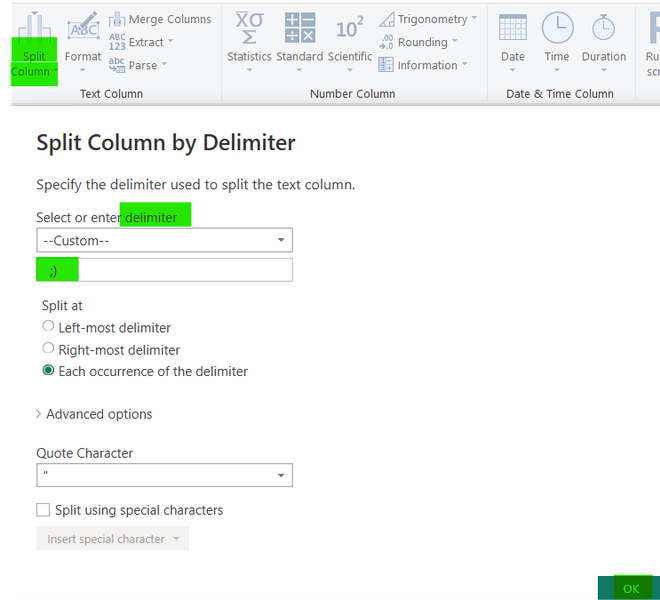
The Split Column feature divides a column into multiple columns. It is available under the Transform tab. A column can be split by:
- Delimiter
- Number of characters
- Position
For example, the Merged column can be split using a delimiter, creating separate columns such as Merged.1 and Merged.2.
Before

After

9. Pivot Column
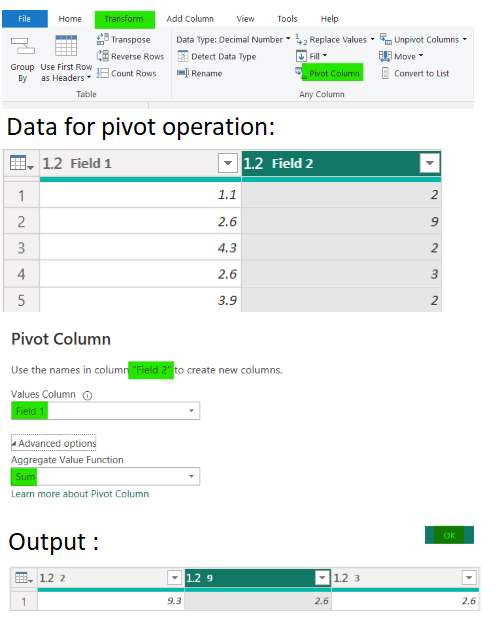
- The Pivot Column feature converts unique values from a column into separate columns. It is useful for reshaping data into a wider format.
- When pivoting, you can select an aggregation such as Sum, Min, Max or Don't Aggregate, depending on the data.
10. Unpivot Columns
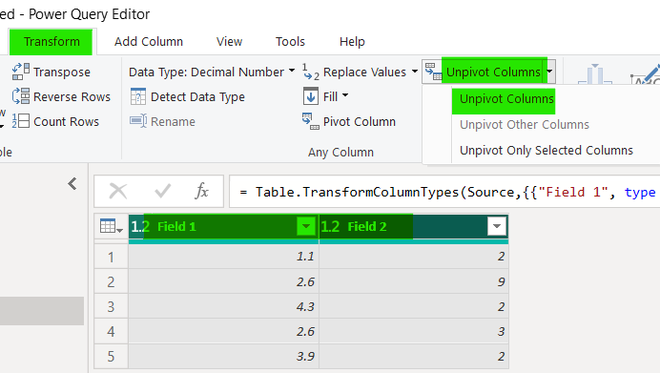
- The Unpivot Columns feature converts columns into rows, creating a more structured format for analysis. It is commonly used when multiple columns represent values that should instead be stored in a single column.
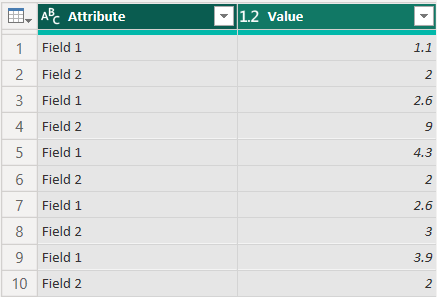
- For example, selecting Field 1 and Field 2 and applying Unpivot converts their values into rows with corresponding attribute and value columns.
Output: