

- Courses
- Tutorials
- Interview Prep
Data Interpretation
Question 1
Study the following table chart and answer the questions based on it. Expenditures of a Company (in Lakh Rupees) per Annum Over the given Years.
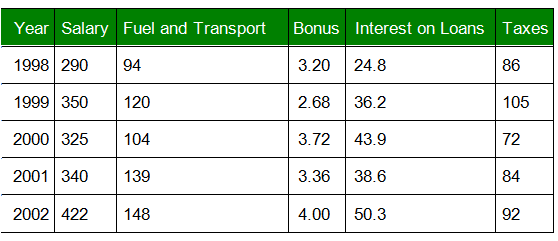
Based on the table answer following 1-5 questions:
What is the average amount of interest per year which the company had to pay during this period ?
- A
35.65
- B
38.76
- C
30.23
- D
40.00
Question 2
Refer Table from Question number 1 and answer the following:
The total amount of bonus paid by the company during the given period is approximately what percent of the total amount of salary paid during this period ?
- A
3.46%
- B
2.65%
- C
0.98%
- D
1.56%
Question 3
Refer Table from Question number 1 and answer the following:
Total expenditure on all these items in 1998 was approximately what percent of the total expenditure in 2002 ?
- A
60%
- B
80%
- C
65%
- D
69.5%
Question 4
Refer Table from Question number 1 and answer the following:
Calculate the total expenditure of the company over these items during the year 2000 from the table chart given.
- A
504.72
- B
548.62
- C
550.53
- D
574.32
Question 5
Refer Table from Question number 1 and answer the following:
The ratio between the total expenditure on Taxes for all the years and the total expenditure on Fuel and Transport for all the years respectively is approximately?
- A
480/689
- B
439/605
- C
439/689
- D
425/605
Question 6
Study the following table carefully and answer the questions given below it:
Number of Different categories of vehicles sold in the country over the years (in thousands)
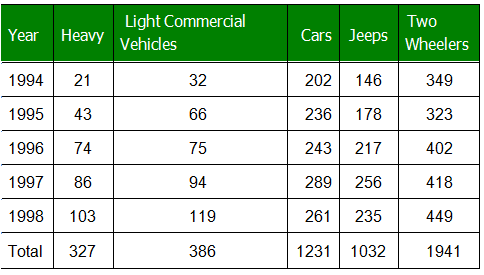
Answer question 6-10 based on data from above table
In which of the following years was the number of light commercial vehicles sold approximately 25% of the number of 2-wheelers sold?
- A
1994
- B
1998
- C
1996
- D
1997
Question 7
Refer Table from Question number 6 and answer the following:
If the same percentage increase in the number of Heavy Vehicle as in 1998 over 1997 is expected in 1999, approximately how many heavy vehicles will be sold in 1999?
- A
138
- B
128
- C
123
- D
166
Question 8
Refer Table from Question number 6 and answer the following:
The number of heavy vehicles sold in 1997 was approximate what percentage of the total number sold in 1996.
- A
12%
- B
7.63%
- C
8.5%
- D
9%
Question 9
Refer Table from Question number 6 and answer the following:
In which year was the number of two-wheelers sold as a percentage of the total number of vehicle sold during that year the highest.
- A
1997
- B
1996
- C
1995
- D
1994
Question 10
Refer Table from Question number 6 and answer the following:
The percentage increase in the sale in 1996 over the previous year was maximum for which of the following category of vehicle.
- A
Cars
- B
2 - Wheelers
- C
Light commercial vehicles
- D
Jeeps
There are 10 questions to complete.