- Courses
- Tutorials
- Interview Prep
GATE EC|| CONTROL SYSTEM || NYQUIST PLOT & BODE PLOT|| PYQS(2000-2025)
Question 1
The polar diagram of a conditionally stable system for open-loop gain K = 1 is shown in the figure. The open-loop transfer function of the system is known to be stable. The closed-loop system is stable for
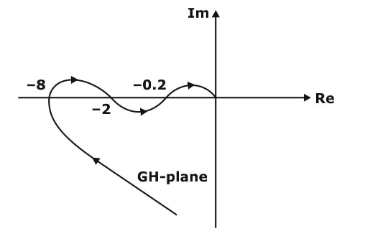
( GATE 2005 || EC || NAT ||2 MARK)
K < 5 and
[Tex]\frac{1}{2}[/Tex]< K < [Tex]\frac{1}{8}[/Tex]
K < [Tex]\frac{1}{8}[/Tex]
and
[Tex]\frac{1}{2}[/Tex]< K < 5
. K < [Tex]\frac{1}{8}[/Tex]
and 5 < K
K <[Tex]\frac{1}{8}[/Tex]
and K < 5
Question 2
The approximate Bode magnitude plot of a minimum-phase system is shown in the figure. The transfer function of the system is
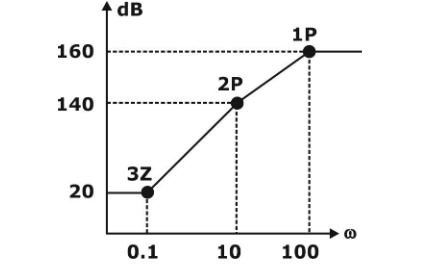
(GATE 2020 || EC || MCQ ||1 MARK)
[Tex]10^8 \frac{(s + 0.1)^3}{(s + 10)^2(s + 100)}[/Tex]
[Tex]10^7 \frac{(s + 0.1)^3}{(s + 10)^2(s + 100)}[/Tex]
[Tex]10^8 \frac{(s + 0.1)^2}{(s + 10)(s + 100)}[/Tex]
[Tex]10^9 \frac{(s + 0.1)^3}{(s + 10)(s + 100)^2}[/Tex]
Question 3
Consider the Bode magnitude plot shown in the figure. The transfer function H(s) is
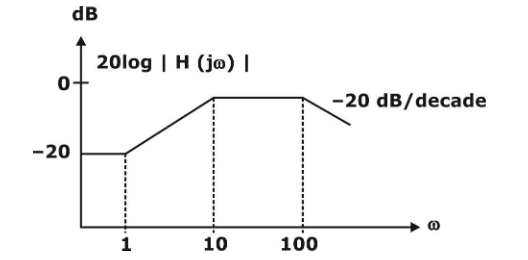
(GATE 2004 || EC || MCQ ||2 MARK)
[Tex]\frac{s + 10}{(s + 1)(s + 100)}[/Tex]
[Tex]\frac{10(s + 1)}{(s + 10)(s + 100)}[/Tex]
[Tex]\frac{10^2(s + 1)}{(s + 10)(s + 100)}[/Tex]
[Tex]\frac{10^3(s + 100)}{(s + 1)(s + 10)}[/Tex]
Question 4
A system has poles at 0.01 Hz, 1 Hz, and 80 Hz; zeros at 5 Hz, 100 Hz, and 200 Hz. The approximate phase of the system response at 20 Hz is
(GATE 2004 || EC || MCQ ||2 MARK)
–90º
0º
90º
–180º
Question 5
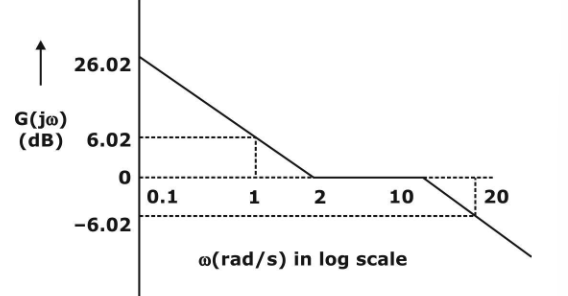
The asymptotic Bode plot of a transfer function is as shown in the figure. The transfer function G(s) corresponding to this Bode plot is
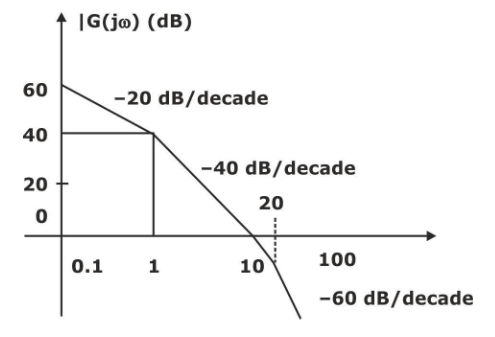
(GATE 2004 || EC || MCQ ||2 MARK)
[Tex]\frac{1}{(s + 1)(s + 20)}[/Tex]
[Tex]\frac{1}{{s}(s + 1)(s + 20)}[/Tex]
[Tex]\frac{100}{{s}(s + 1)(s + 20)}[/Tex]
[Tex]\frac{100}{{s}(s + 1)(1+ 0.5s)}[/Tex]
Question 6
For the asymptotic Bode magnitude plot shown below, the system transfer function can be
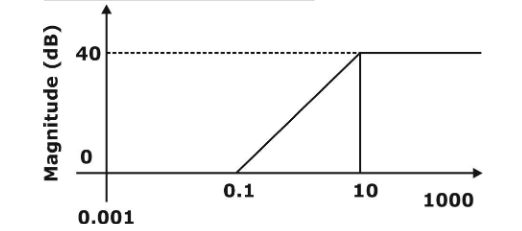
(GATE 2010 || EC || MCQ ||1 MARK)
[Tex]\frac{10s + 1}{0.1s + 1}[/Tex]
[Tex]\frac{100s + 1}{0.1s + 1}[/Tex]
[Tex]\frac{100s}{10s + 1}[/Tex]
[Tex]\frac{0.1s + 1}{10s + 1}[/Tex]
Question 7
The Bode plot of a transfer function G(s) is shown in the figure below:
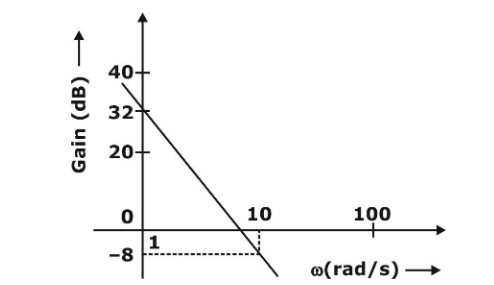
The gain (201og |G(s)|) is 32 dB and –8 dB at 1 rad/s and 10 rad/s respectively. The phase is negative for all ω Then G(s) is
(GATE 2013 || EC || MCQ ||1 MARK)
[Tex]\frac{39.8}{s}[/Tex]
[Tex]\frac{39.8}{s^2}[/Tex]
[Tex]\frac{32}{s}[/Tex]
[Tex]\frac{32}{s^2}[/Tex]
Question 8
The bode asymptotic magnitude plot of a minimum phase system is shown in the figure.
If the system is connected in a unity negative feedback configuration, the steady-state error of the closed-loop system to a unit ramp input is
(GATE 2014 || EC || NAT ||2 MARK)
0.5
Question 9
In a Bode magnitude plot, which one of the following slopes would be exhibited at high frequencies by a 4th-order all-pole system?
(GATE 2014 || EC || MCQ ||2 MARK)
–80 dB/decade
–40 dB/decade
+40 dB/decade
+80 dB/decade
Question 10
Consider the Bode plot shown in the figure. Assume that all the poles and zeros are real-valued.
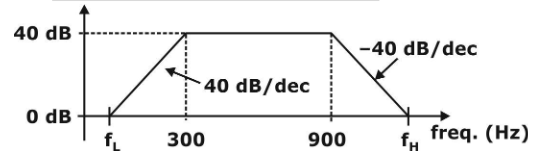
The value of fH – fL (in Hz) is ______.
( GATE 2015 || EC || MCQ ||1 MARK)
8970
There are 27 questions to complete.