A confusion matrix is a table that helps evaluate how well a classification model performs. It compares the actual values with the predicted ones, providing a detailed view of correct and incorrect classifications. The structure consists of rows for actual classes and columns for predicted classes.
The key components of a confusion matrix include:
- True Positive (TP): Correctly predicted as positive
- True Negative (TN): Correctly predicted as negative
- False Positive (FP): Incorrectly predicted as positive
- False Negative (FN): Incorrectly predicted as negative
These values help us derive performance metrics like accuracy, precision, recall and specificity.
Creating a Confusion Matrix in R
R provides various packages for working with confusion matrices, such as caret, MLmetrics and yardstick. Below we explore creating and interpreting confusion matrices using the caret package.
1. Binary Classification
We create a confusion matrix from actual and predicted binary class labels and evaluate model performance.
install.packages("caret")
library(caret)

actual <- factor(c(1, 0, 1, 1, 0, 0, 1, 0, 1, 0))
predicted <- factor(c(1, 0, 1, 1, 0, 0, 1, 0, 1, 0))

conf_matrix <- confusionMatrix(actual, predicted)

print(conf_matrix)
Output:

The model achieved perfect classification with an accuracy of 1. All predicted labels matched the actual ones, resulting in no false positives or false negatives.
2. Multi-class Classification
We build a classification model on the Iris dataset and evaluate its performance using a confusion matrix.
library(caret)

data(iris)

set.seed(123)
train_index <- createDataPartition(iris$Species, p = 0.8, list = FALSE)
train_data <- iris[train_index, ]
test_data <- iris[-train_index, ]

model <- train(Species ~ ., data = train_data, method = "rpart")

predicted <- predict(model, test_data)

conf_matrix <- confusionMatrix(test_data$Species, predicted)

print(conf_matrix)
Output:
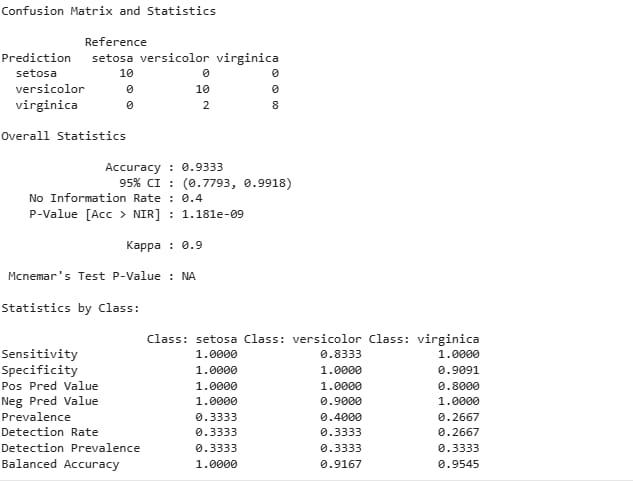
The model performs well with an accuracy of 93.33%. It perfectly classifies Setosa and Virginica but misclassifies two Versicolor instances as Virginica.
Interpreting the Confusion Matrix
From the matrix, we calculate key performance metrics:
- Accuracy: Overall proportion of correct predictions
- Precision: Correct positive predictions divided by total predicted positives
- Recall (Sensitivity): Correct positive predictions divided by total actual positives
- Specificity: Correct negative predictions divided by total actual negatives
- F1 Score: Harmonic mean of precision and recall
These metrics help assess how well the model generalizes and where it may need improvement.