Monitoring and Logging in Spring Boot
Last Updated :
08 Oct, 2025
Spring Boot is widely used for developing standalone, enterprise-level Java applications. While logging and monitoring are not mandatory for all applications, including them is a best practice for production-ready systems.
Monitoring
Spring Boot provides built-in features for managing and monitoring applications using HTTP endpoints. The Spring Boot Actuator module exposes several endpoints that provide runtime information about the application.
Step 1: Create a Spring Boot project
Use Spring Spring Initializr to create a project with the following settings:
- Project: Maven
- Language: Java
- Spring Boot Version: 3.2.1 or above
- Packaging: Jar
- Java Version: 17 or above
- Dependencies: Spring Web
Open the project in your preferred IDE.
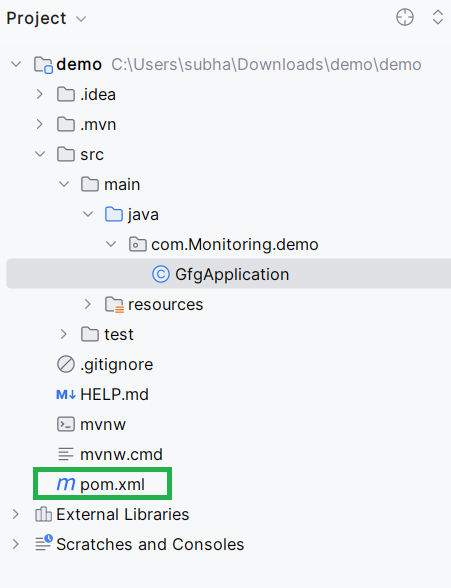
Step 2: Add Spring Boot Actuator Dependency

Add the following dependency in pom.xml:
XML
<dependency>
    <groupId>org.springframework.boot</groupId>
    <artifactId>spring-boot-starter-actuator</artifactId>
</dependency>
For Gradle:
dependencies {
implementation 'org.springframework.boot:spring-boot-starter-actuator'
}
This enables Actuator, which provides endpoints for monitoring application health, metrics, beans, and more.
Step 3: Configure Actuator
In application.properties:
management.endpoints.web.base-path=/admin
management.endpoints.web.exposure.include=*
management.endpoint.health.show-details=always
- Exposes all endpoints under /admin.
- Always displays detailed health information such as disk space and database connectivity.
Step 4: Access Monitoring Endpoints
Run the application (default port 8080). Access the monitoring dashboard at:
http://localhost:8080/admin

Actuator exposes endpoints such as:
- /admin/health: Application health status
- /admin/beans: Beans loaded in the application context
- /admin/metrics: Application metrics
- /admin/loggers: Log level details
- /admin/heapdump: JVM heap dump
- /admin/threaddump: Thread dump
Individual endpoints provide detailed information for performance monitoring and troubleshooting.
Logging in Spring Boot
Spring Boot uses SLF4J (Simple Logging Facade for Java) as an abstraction and Logback as the default logging implementation. Logging helps track application behavior and errors.
Step 1: Create a Controller
Create a simple controller to test logging.
LoggingController.java
Java
import org.slf4j.Logger;
import org.slf4j.LoggerFactory;
import org.springframework.web.bind.annotation.RequestMapping;
import org.springframework.web.bind.annotation.RestController;

@RestController
public class LoggingController {

    Logger logger = LoggerFactory.getLogger(LoggingController.class);

    @RequestMapping("/")
    public String index() {
        logger.info("INFO Message");
        logger.warn("WARN Message");
        logger.error("ERROR Message");
        return "Hello World!";
    }
}
- Logger triggers log events.
- LoggerFactory creates logger instances.
- getLogger(Class) binds the logger to the class for context-specific logging.
Step 2: Run and Observe Logs
Run the application and access http://localhost:8080/. Logs will appear in the console:

Logging can be customized using Logback configuration files for log levels, formatting, appenders, and rolling policies to manage log file sizes.
Explore
Spring Boot Basics and Prerequisites
Spring Boot Core
Spring Boot with REST API
Spring Boot with Database and Data JPA
Spring Boot with Kafka
Spring Boot with AOP