How to Create a Dendrogram in Plotly?
Enhance your data analysis skills with our guide on creating dendrograms in Plotly. Learn the process from start to finish with clear, concise instructions.
A dendrogram is a tree-like diagram often used in hierarchical clustering to visualize the arrangement of the clusters formed during the clustering process. Plotly is a powerful Python library for creating interactive visualizations, including dendrograms. This code example will help you learn how to create a dendrogram using Plotly in Python.
Table of Contents
What is a Dendrogram in Plotly?
A dendrogram in Plotly is a graphical representation of hierarchical clustering, a method for grouping similar data points into clusters based on their proximity. A dendrogram visually displays the arrangement of these clusters in a tree-like structure, where the closer the branches or clusters are, the more similar they are.
Plotly Dendrogram Example
Dendrograms can be created using the plotly.figure_factory.create_dendrogram function, which allows you to specify the data and parameters for creating the dendrogram.
Here's a basic example of how to create a dendrogram using Plotly:

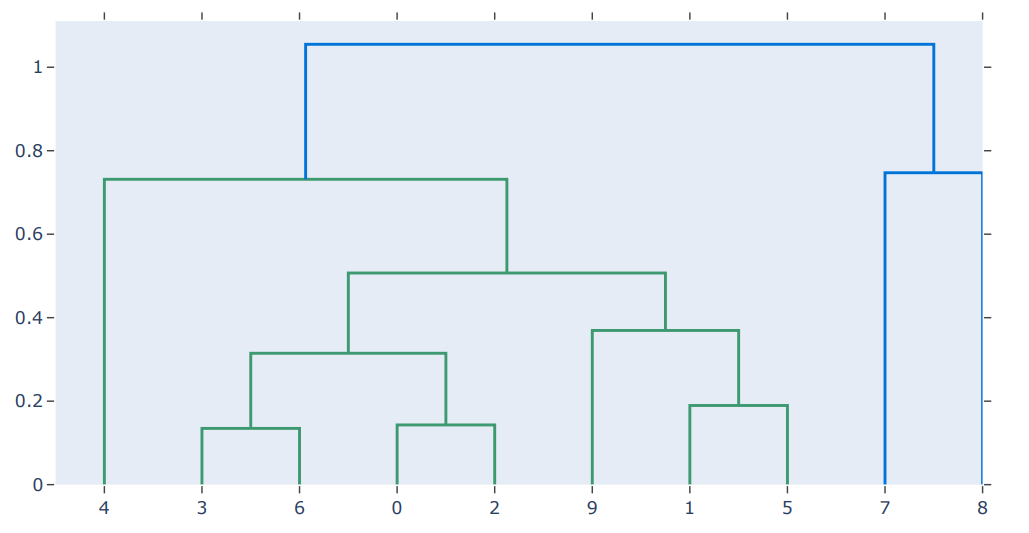
X is a random dataset with 10 data points and two features. We then use ff.create_dendrogram to create the dendrogram from this data. Finally, we update the layout of the figure to set the width and height and then display the dendrogram using fig.show().
Step-by-Step Guide to Creating a Dendrogram in Python
Here's a more comprehensive step-by-step guide to creating a dendrogram in Python using Plotly:
Step 1 - Import libraries
import plotly.figure_factory as pff
import numpy as np
Step 2 - Take Sample data
data = np.random.rand(5,5)
names = ["James","Heena","Vidhi","Aron","Simon"]
Step 3 - Plot Graph
fig = pff.create_dendrogram(data, orientation="left",labels=names)
fig.update_layout({'width':1000, 'height':700})
fig.show()

How to Create a Plotly Dendrogram from Distance Matrix?
Let’s now create a Dendrogram in Plotly from the distance matrix -
Step 1: Import Necessary Libraries

Step 2: Prepare Data
You need to prepare the data before creating the dendrogram. Typically, dendrograms are created from hierarchical clustering results or distance matrices. Here, we will demonstrate how to make a dendrogram from a distance matrix.

Step 3: Create a Dendrogram from the Distance Matrix
The following code snippet generates a dendrogram visualization using Plotly's create_dendrogram function.


Master Excellent Data Visualization Skills with ProjectPro!
This tutorial has walked you through the steps required to create dendrograms that highlight the importance of understanding the underlying concepts and the practical application of these techniques. Remember that hands-on experience must complement theoretical knowledge as you refine your skills. Engaging in real-world projects is the best way to cement your learning and gain a deeper understanding of data visualization concepts. This is where ProjectPro becomes an invaluable resource. Its extensive repository of over 250+ projects around data science and big data allows you to apply what you've learned in real-world scenarios. Practicing these projects enhances your practical skills and builds a robust portfolio that showcases your ability to tackle real-world data challenges.

What Users are saying..

Jingwei Li
ProjectPro is an awesome platform that helps me learn much hands-on industrial experience with a step-by-step walkthrough of projects. There are two primary paths to learn: Data Science and Big Data.... Read More