Grade 5 Probability Learning Activity
Uploaded by
Florame Algarme MelanoGrade 5 Probability Learning Activity
Uploaded by
Florame Algarme Melano- Introduction and Key Concepts
- Probability Solutions and Activities
- Rubric and Reflection
- Answer Key and References
Common questions
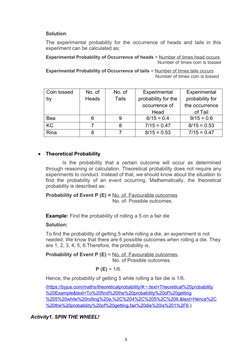
Powered by AIUnderstanding simple events like a coin toss, which has two possible outcomes (heads or tails), helps develop foundational knowledge in probability. It illustrates the definition of a simple event — which can occur in only one way. Mastery in this concept aids in comprehending more complex probabilistic scenarios by building on this binary decision model .
Experimental probability allows manufacturers to estimate future defective rates based on past empirical data. Given the example of inspecting phones, if 2% of 1000 inspected phones are defective, this probability can predict potentially 1000 defective phones in a batch of 50,000 produced monthly . While useful for planning and risk assessment, this estimate is valid only if conditions remain consistent.
Theoretical probability requires the formula P(E) = Number of Favorable Outcomes / Number of Possible Outcomes. When rolling a six-sided die, the probability of each outcome (like rolling a 5) is calculated by identifying that each die face is a favorable outcome out of 6 total faces, leading to a probability of 1/6 for rolling a particular number .
Theoretical probability is preferred in casino games due to its precise and stable nature, relying on clear mathematical models rather than empirical data, which might vary with each experiment. This reliability is critical where formal fairness rules are required, as in casinos where the odds must be predefined and consistently applied .
Concept maps serve to effectively summarize probability-related terms by visually organizing key concepts and illustrating the relationships between them, enhancing comprehension and recall. Such a map might include branches for types of probability (experimental vs. theoretical), examples of events, and calculations, which aids learners in seeing the comprehensive picture and understanding better .
The theoretical probability is defined using the formula: Probability of an event = No. of Favorable Outcomes / Total No. of Possible Outcomes. In a mixed bag with 20 marbles where 8 are blue, the probability of drawing a blue marble is 8/20 or 2/5. This indicates that theoretical models can predict outcomes in controlled environments with predetermined conditions, highlighting their utility in forecasting under ideal circumstances .
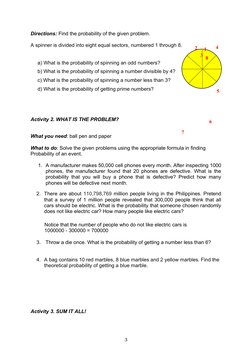
To determine the odds of landing on a specific type of number using a spinner divided into equal sections, identify the number of favorable outcomes and divide by the total number of sections. For example, in an 8-section spinner, the probability of landing on an odd number is calculated by dividing the number of odd-numbered sections by the total, i.e., there are 4 odd numbers out of 8, leading to a probability of 4/8 or 1/2 .
Larger sample sizes generally provide more reliable and stable estimates of experimental probability, as they tend to average out anomalies more effectively than smaller sizes. Conversely, smaller samples might offer less consistent predictions due to greater variability and sample bias. Therefore, predictions from larger samples better approximate the real distribution of outcomes, enhancing decision-making accuracy in uncertainties .
Experimental probability is based on actual experiments and results in real data, making it reliable for empirical verification but dependent on the conditions of each experiment. Theoretical probability relies on mathematical models and assumptions, which offer a broader application as they do not require empirical trials but are limited by the precision of model assumptions and reasoning .
Experimental probability, when applied to surveys, can elucidate human preferences by analyzing the frequency and patterns of selections made by a sample population. For instance, if a survey shows that 30% of respondents favor electric cars, businesses can anticipate trends and shifts in market demand, adjusting strategies accordingly. This relies on actual consumer behavior rather than theoretical assumptions .