Benjamini-Hochberg Procedure
Last Updated :
23 Jul, 2025
In research, it is common to run many statistical tests at the same time. For example, scientists might test hundreds of genes to find out which ones are linked to a disease. However, when many tests are performed, the chances of getting false positives increase. A false positive is a result that appears to be significant but actually happened by chance. To handle this problem, statisticians use correction methods. One commonly used method is the Benjamini Hochberg (BH) Procedure. Unlike very strict methods such as the Bonferroni correction, which try to eliminate all false positives, the BH method aims to control the False Discovery Rate (FDR), which is the expected proportion of false positives among the results that are considered significant.
What is the Benjamini-Hochberg Procedure?
- Step 1: Collect all p-values from your tests.
- Step 2: Sort the p-values in ascending order.
- Step 3: Assign ranks (1 for smallest p-value, up to n).
- Step 4: Choose your FDR level (e.g., Q = 0.05).
- Step 5: For each p-value, calculate:
\text{Threshold} = \frac{\text{Rank} \times Q}{n}
- Step 6: Find the largest p-value ≤ its threshold.
- Step 7: Reject all hypotheses with p-values ≤ that value
Why Do We Need It?
- In multiple testing, the more tests you run, the more likely you are to find significant results by chance.
- For example, testing 100 genes at a significance level of 0.05 could lead to 5 false positives even if none of the genes are truly related to the disease.
- Traditional corrections like Bonferroni reduce this risk but can be too strict, often missing real effects (higher Type II error).
- The BH procedure offers a balance, allowing some false positives but keeping their rate under control.
Important Terms to Understand
Before diving into how it works, let’s clarify a few key terms:
- P-value: Probability of seeing the observed results if the null hypothesis is true.
- Null Hypothesis: The default assumption (e.g., no effect or no difference).
- Rejection of Null: We conclude something is statistically significant.
- False Positive (Type I Error): Rejecting a true null hypothesis.
- False Discovery Rate (FDR): The expected proportion of false positives among all rejections.
Step-by-Step Explanation of the BH Procedure
Suppose we perform m hypothesis tests and obtain m p-values. Here's how the Benjamini-Hochberg procedure works:
Step 1: Arrange p-values in ascending order. Let p_1, p_2, ..., p_m be the sorted p-values from smallest to largest.
Step 2: Choose a desired FDR level q. Common values are 0.05 or 0.1 depending on how strict we want to be.
Step 3: Find the largest k such that.
p_{(k)} \le \frac{k}{m} \cdot q
Step 4: Reject all the null hypotheses for all p-values.
BH Procedure in Practice
Python
import numpy as np
from statsmodels.stats.multitest import multipletests

# Example p-values
p_values = [0.01, 0.04, 0.03, 0.005, 0.12]

# Apply Benjamini-Hochberg correction
reject, pvals_corrected, _, _ = multipletests(p_values, alpha=0.05, method='fdr_bh')

print("Adjusted p-values:", pvals_corrected)
print("Reject null hypotheses:", reject)
Output
Adjusted p-values: [0.025 0.05 0.05 0.025 0.12 ]
Reject null hypotheses: [ True True True True False]
Visualization Example
Plotting the original and corrected p-values can help understand the effect of the BH procedure.
Python
import matplotlib.pyplot as plt

plt.plot(sorted(p_values), label="Original p-values", marker='o')
plt.plot(sorted(pvals_corrected), label="BH corrected p-values", marker='x')
plt.axhline(0.05, color='red', linestyle='--', label='α = 0.05')
plt.legend()
plt.xlabel("Rank")
plt.ylabel("P-value")
plt.title("Benjamini-Hochberg Correction")
plt.show()
Output
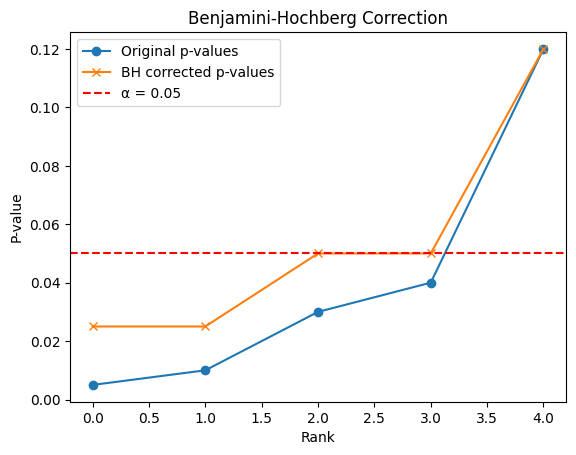 Benjamini-Hochberg Correction
- The blue line shows the original p-values from multiple tests, sorted by rank (smallest to largest).
- The orange line shows the p-values after applying the Benjamini-Hochberg correction, which adjusts them to reduce false positives.
- The red dashed line is the significance level (α = 0.05); any point below this line is considered statistically significant after correction.
Best Practices
- Report both raw and adjusted p-values in research papers.
- Use BH correction when testing many hypotheses and some false positives are acceptable.
- Don’t mix methods (e.g., using both Bonferroni and BH on the same results).
Key Advantages
- Less conservative than methods like Bonferroni, which can miss real findings.
- More statistical power, especially in large-scale testing like in genomics.
- Works well even when p-values are not completely independent (though ideal under independence).
Limitations
- Assumes that the tests are either independent or positively dependent.
- Doesn’t guarantee that all rejected hypotheses are truly significant only controls the expected proportion.
- Not as strict as Bonferroni some false positives are still expected.
Explore
Introduction to Machine Learning
Python for Machine Learning
Introduction to Statistics
Feature Engineering
Model Evaluation and Tuning
Data Science Practice