Remote Sensing Image Classification
Last Updated :
22 Jul, 2025
Remote sensing image classification involves analyzing satellite or aerial imagery to label land types such as vegetation, water and urban areas. It automates land-use monitoring using pixel values across spectral bands. Classification can be supervised (with labeled training data) or unsupervised (without labels). It is used to map deforestation or urban expansion using satellite imagery.
Features of Remote Sensing Image Classification
1. Multispectral and Hyperspectral Input: Remote sensing images contain data from more than just the visible light spectrum. Most satellite imagery includes multispectral or even hyperspectral bands such as near-infrared and shortwave infrared. These additional bands help differentiate between surface materials that look similar in visible light but reflect differently in other wavelengths.
2. Pixel-Based or Object-Based Classification: The classification process can be performed at the individual pixel level or at a higher level using segmented groups of pixels called objects.
- Pixel-based approaches work well with high-resolution data where each pixel represents fine detail.
- Object-based classification uses spatial and contextual information and is often preferred when dealing with high-resolution or complex imagery.
3. Supervised and Unsupervised Methods: There are two main types of classification:
- Supervised classification involves training a model using labeled data where the land cover types are already known for certain locations.
- Unsupervised classification such as K-means clustering, groups pixels into categories based on spectral similarity without using any labeled data.
4. Spectral Signatures: Different materials on the Earth’s surface like vegetation, water or urban structures have unique spectral reflectance patterns across the various bands in satellite imagery. These spectral signatures allow classifiers to distinguish between land cover types by comparing pixel values across multiple wavelengths.
5. Temporal Monitoring Capabilities: Satellite images can be captured repeatedly over the same area at different times. This allows for temporal analysis, enabling the monitoring of changes in land use or vegetation over seasons or years. Such time-series data are particularly useful for detecting gradual changes like deforestation or crop cycles.
6. Sensitivity to Spatial Resolution: The spatial resolution of satellite imagery significantly affects classification outcomes. Higher-resolution images offer more detail and allow for finer classification but require more processing power and storage. Lower-resolution images may be quicker to process but may miss subtle land cover differences.
Working of Remote Sensing Image Classification
- Image Acquisition: Remote sensing classification typically begins with acquiring satellite imagery. In most simple implementations, this involves using multi-bands such as red, green, blue, etc.
- Preprocessing: Before any classification can happen, the raw satellite data must be cleaned and corrected. This includes radiometric correction, geometric correction and atmospheric correction. These adjustments ensure that the image is usable and consistent for further analysis.
- Training Data Collection: In supervised learning, labeled data is necessary. This involves manually selecting areas on the image where the actual land cover type is known like buildings, vegetation or water. These are used as ground truth and are typically collected using GIS tools or from field surveys. These labels are essential for teaching the model what patterns to learn.
- Feature Extraction: Each pixel in remote sensing data has values across multiple spectral bands. These values act as features. Use raw pixel values or derived indices and additional features like texture, descriptors, etc.
- Classifier Selection: Next, a classification model is selected. This can be a simple machine learning algorithm like Random Forest or SVM or more complex deep learning methods like CNNs or U-Net. The choice depends on the size of data, required accuracy and available computational power. For simple tasks, traditional ML classifiers are often good enough.
- Classification: The selected model is trained on the labeled samples and then applied to the rest of the image. Each pixel is assigned a land cover class such as forest, water or urban.
- Post-Processing: After classification, the resulting map might be noisy or scattered. To improve the visual quality, post-processing techniques like majority filtering or smoothing are applied.
- Accuracy Assessment: Finally, the quality of the classification is evaluated. This includes calculating the confusion matrix, overall accuracy, etc. These metrics provide a good understanding of the model’s performance.
Implementation of Remote Sensing Image Classification
1. Installing Libraries and Dependencies
Here we will import numpy, matplotlib and scikit learn.
Python
!pip install scikit-learn matplotlib rasterio numpy

import numpy as np
import matplotlib.pyplot as plt
import rasterio
from sklearn.ensemble import RandomForestClassifier
from sklearn.metrics import classification_report
from sklearn.model_selection import train_test_split
Output
 Installation of libraries
2. Image Acquisition
Remote sensing classification typically begins with acquiring satellite imagery. Here, we have used a real satellite image which you can download from here.
Python
np.random.seed(42)
try:
    with rasterio.open('/content/satellite_image.tif') as src:
        image = src.read()
        X = image.transpose(1, 2, 0).reshape(-1, src.count)
        y = np.random.choice([0, 1, 2], size=(X.shape[0]))
except rasterio.errors.RasterioIOError:
    print("Error opening the image file.")
    image = np.random.rand(100, 100, 3)
    X = image.reshape(-1, 3)
    y = np.random.choice([0, 1, 2], size=(X.shape[0]))
It attempts to open a real ".tif" satellite image using rasterio. It reshapes the 3D image data into a 2D feature array where each pixel becomes one sample. If the image file is missing or can't be opened, the "except" block runs.
3. Preprocessing
This section ensures data doesn't contain NaN or inf values. Non-finite values in the feature matrix X or label vector y are replaced with 0. It prevents the model from crashing during training due to invalid data.
Python
if not np.all(np.isfinite(X)):
    print("Warning: X contains non-finite values. Replacing with 0.")
    X[~np.isfinite(X)] = 0

if not np.all(np.isfinite(y)):
    print("Warning: y contains non-finite values. Replacing with 0.")
    y[~np.isfinite(y)] = 0
4. Training Data Collection
Splits the dataset into 80% training and 20% testing sets. X_train and y_train will be used for training while X_test and y_test are for evaluation. This helps assess model performance on unseen data.
Python
X_train, X_test, y_train, y_test = train_test_split(X, y, test_size=0.2)
5. Train the Random Forest Classifier
Initializes a random forest with 50 decision trees. Fits the model on training data to learn patterns in the satellite image. The random state ensures reproducibility of results.
Python
clf = RandomForestClassifier(n_estimators=50, random_state=42)
clf.fit(X_train, y_train)
6. Make Predictions on Test Set
The selected model is trained on the labeled samples and then applied to the rest of the image.
Python
y_pred = clf.predict(X_test)
The trained model predicts class labels for the test features.
7. Evaluate the Model and Predict Full Image
Generates a classification report including precision, recall and F1-score. Helps analyze performance of the model across all classes. Useful for identifying class-wise strengths and weaknesses. The full image is classified, predictions are reshaped to match the spatial structure of the image.
Python
print(classification_report(y_test, y_pred))

if 'src' in locals():
    classified = clf.predict(X).reshape(src.height, src.width)
    original_image_display = image.transpose(1, 2, 0)
else:
    classified = clf.predict(X).reshape(100, 100)
    original_image_display = image
Output
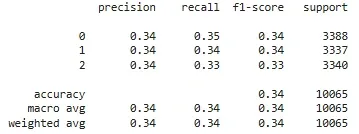 Classification Report for Image Classification
8. Visualize Original and Classified Image
Displays two side-by-side plots: the input RGB image and the classification result. The left shows raw image colors while the right shows predicted class regions.
Python
fig, ax = plt.subplots(1, 2, figsize=(10, 5))
ax[0].imshow(original_image_display)
ax[0].set_title("Original RGB Image")
ax[1].imshow(classified, cmap='viridis')
ax[1].set_title("Classified Map")
plt.show()
Output
 Original RGB Satellite Image vs Classified Image Map
We can further fine-tune the model and gain better classified images.
Applications
- Land use and land cover mapping: Used to identify areas like forests, cities and water bodies.
- Disaster detection and damage assessment: Helps in spotting floods, fires and affected zones.
- Crop monitoring and yield prediction: Tracks crop health and estimates production.
- Environmental change tracking: Monitors changes in forests, wetlands and pollution levels.
- Urban growth and infrastructure planning: Assists in analyzing city expansion and planning roads or buildings.
- Climate change observation: Detects glacier melting, sea-level rise and temperature-based land changes.
- Natural resource management: Supports mapping and managing water, minerals and forest resources.
Advantages
- Covers large areas quickly: Ideal for monitoring vast or remote regions.
- Time-efficient and cost-effective: Reduces the need for field visits.
- Multi-temporal analysis: Can track changes over time with historical satellite data.
- High accuracy with modern methods: Machine learning improves classification quality.
- Useful in inaccessible or dangerous areas: Like mountains, oceans or disaster-hit zones.
Disadvantages
- Requires expert knowledge: To choose the right classification method and interpret results correctly.
- Affected by atmospheric conditions: Clouds, haze or shadows can reduce image quality.
- Sensor limitations: Resolution, coverage and update frequency may not suit all needs.
- Ground truth data needed: Validation with real-world data is often necessary but not always available.
- Class confusion: Similar-looking classes like dry soil vs. urban rooftops can be misclassified.
Remote sensing image classification plays a key role in analyzing Earth's surface, offering valuable insights across fields like agriculture, environment and urban planning.
You can download source code from here.
Similar Reads
Interview Preparation
Practice @Geeksforgeeks
Data Structures
Algorithms
Programming Languages
Web Technologies
Computer Science Subjects
Data Science & ML
Tutorial Library
GATE CS