Disabling Scientific Notation on Axes Using Bokeh
Last Updated :
23 Jul, 2025
Bokeh is a powerful and flexible Python library used to create interactive plots and data visualizations. One of the default features of Bokeh is its ability to format large or small numbers using scientific notation on the axes of your plots. While this is useful in certain contexts, there are many cases where scientific notation may not be desirable, such as when presenting data to a non-technical audience. Fortunately, Bokeh provides easy ways to disable scientific notation and format axes to display numbers in a more traditional, readable format.
In this article, we will explore different ways to disable scientific notation on Bokeh axes, including customizing tick formatting and providing example code to showcase these techniques.
Understanding Scientific Notation in Bokeh
Scientific notation is a way of representing numbers that are too large or too small to be conveniently written in decimal form.
When plotting large or very small numbers, Bokeh, by default, may display the tick labels on axes in scientific notation. For instance, numbers like 1,000,000 could be displayed as 1.0e6, and very small numbers like 0.0001 could be displayed as 1.0e-4. While this format is convenient in some contexts, it might not be ideal for presentations where clarity and simplicity are required.
Example of Scientific Notation in Bokeh:
Python
from bokeh.plotting import figure, show
from bokeh.io import output_notebook

output_notebook()

# Create a figure with large Y values
p = figure(width=400, height=400)

# Add a line plot with large values on the Y-axis
p.line([1, 2, 3, 4], [1000000, 2000000, 3000000, 4000000])

# Show the plot
show(p)
Output:
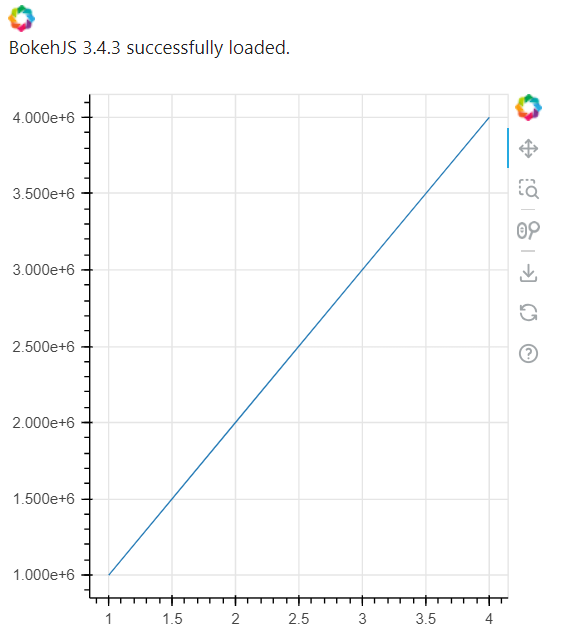 Output
In the above code, the Y-axis will display numbers in scientific notation (e.g., 1.0e6 for 1,000,000). To disable this default behavior, we need to customize how Bokeh formats these axis tick labels.
Bokeh provides several ways to customize the appearance of tick labels, including the use of tick formatters. One of the most commonly used formatters is PrintfTickFormatter, which allows you to specify how numeric values should appear on the axes.
PrintfTickFormatter uses a format string similar to the C-style string formatting, where you can define the number of decimal places, and control whether scientific notation is used.
Steps to Disable Scientific Notation:
- Create a Bokeh figure as usual.
- Apply the PrintfTickFormatter to the axis you want to modify.
- Use a format string like "%.0f" or "%.2f" to specify the desired format.
Code Example to Disable Scientific Notation:
Python
from bokeh.plotting import figure, show
from bokeh.models import PrintfTickFormatter
from bokeh.io import output_notebook

output_notebook()

# Create a figure
p = figure(width=400, height=400)

# Add a line plot with large Y values
p.line([1, 2, 3, 4], [1000000, 2000000, 3000000, 4000000])

# Disable scientific notation on the Y-axis using PrintfTickFormatter
p.yaxis.formatter = PrintfTickFormatter(format="%.0f")

# Show the plot
show(p)
Output:
 Disabling Scientific Notation with Tick Formatters
Explanation:
- The line p.yaxis.formatter = PrintfTickFormatter(format="%.0f") disables scientific notation on the Y-axis and formats the labels as floating-point numbers with zero decimal places.
- The format string "%.0f" tells Bokeh to format the numbers with no decimal places. You can adjust this format to suit your needs (e.g., "%.2f" for two decimal places).
The NumeralTickFormatter is one of the most versatile formatters in Bokeh, allowing you to specify the exact format of the tick labels. To disable scientific notation, you can set the format property to a string that represents the desired number format.
Python
from bokeh.plotting import figure, show
from bokeh.models import NumeralTickFormatter

# Create a new plot
p = figure()

# Add a circle renderer
p.circle([1e6, 2e6, 3e6], [1e6, 2e6, 3e6])

# Set the y-axis formatter to disable scientific notation
p.yaxis.formatter = NumeralTickFormatter(format="0")

# Show the plot
show(p)
Output:
 Disabling Scientific Notation with Bokeh Formatters
In this example, the format="0" argument ensures that the numbers are displayed as integers without scientific notation
For more complex formatting needs, the FuncTickFormatter allows you to write custom JavaScript code to format tick labels. This can be useful if you need to apply specific formatting logic that isn't covered by the built-in formatters.
Python
from bokeh.plotting import figure, show
from bokeh.models import FuncTickFormatter

# Create a new plot
p = figure()

# Add a circle renderer
p.circle([1e6, 2e6, 3e6], [1e6, 2e6, 3e6])

# Set the y-axis formatter using custom JavaScript code
p.yaxis.formatter = FuncTickFormatter(code="""
    return tick.toFixed(0);
""")

# Show the plot
show(p)
Output:
 Disabling Scientific Notation with Bokeh Formatters
This example uses JavaScript to format the tick labels as integers, effectively disabling scientific notation
Conclusion
Disabling scientific notation in Bokeh is a straightforward process once you understand the available formatters and their configurations. Bokeh provides flexible options to tailor your visualizations to your audience's needsw numbers are formatted on the axes, including the number of decimal places and whether to include thousands separators.