Displaying Two Different Legends in hconcat Chart Using Altair
Last Updated :
23 Jul, 2025
Altair is a powerful visualization library in Python that allows for creating a wide range of charts. One of its features is the ability to concatenate charts horizontally using the hconcat method. However, when dealing with multiple charts, managing legends can become challenging, especially if you want to display two different legends for two concatenated charts. This article will guide you through the process of displaying two distinct legends in an hconcat chart using Altair.
Understanding Altair's hconcat Functionality
Altair's hconcat function allows you to place charts side-by-side. This is particularly useful when you want to compare different datasets or different views of the same dataset.
Challenges with Legends in hconcat Charts
When using hconcat, Altair may combine legends from both charts into a single legend. This can be problematic if the legends represent different categorical variables or if you want to maintain separate legends for clarity. The main challenges include:
- Combined Legends: Altair might merge legends, leading to misleading representations.
- Legend Overlap: Entries from one chart may appear in the legend of another chart.
- Customization Limitations: Default settings may not provide the desired level of customization for each legend.
Displaying Two Different Legends
To display two different legends in an hconcat chart, you need to ensure that the legends are resolved independently. This can be achieved using the resolve_legend method. Here's how you can do it:
Step 1: Install and Import Altair
If you haven't installed Altair yet, you can do so with pip:
Python
Next, import the necessary libraries:
Python
import altair as alt
import pandas as pd
import numpy as np
Step 2: Create a Sample Dataset
We'll start by creating a sample dataset that we can use to create two different charts:
Python
data = pd.DataFrame({
    'category': ['A', 'B', 'C', 'D', 'E'],
    'value1': [10, 15, 13, 7, 9],
    'value2': [5, 10, 15, 20, 25]
})
This dataset contains two value columns (value1 and value2) for different categories.
Step 3: Create the First Chart with a Legend
Let's create the first bar chart that will have its own legend:
Python
# First bar chart with legend
chart1 = alt.Chart(data).mark_bar().encode(
    x=alt.X('category:N', title='Category'),
    y=alt.Y('value1:Q', title='Value 1'),
    color=alt.Color('category:N', legend=alt.Legend(title='Category Legend 1'))
).properties(
    title='Bar Chart 1'
)
This chart displays the categories along the x-axis, the values of value1 on the y-axis, and uses color to distinguish between categories.
Step 4: Create the Second Chart with a Different Legend
Now, let's create a second bar chart with a different legend:
Python
# Second bar chart with legend
chart2 = alt.Chart(data).mark_bar().encode(
    x=alt.X('category:N', title='Category'),
    y=alt.Y('value2:Q', title='Value 2'),
    color=alt.Color('value2:Q', legend=alt.Legend(title='Value 2 Legend'), scale=alt.Scale(scheme='blues'))
).properties(
    title='Bar Chart 2'
)
This chart also displays the categories along the x-axis, but the y-axis shows the values of value2, and the color encoding is based on the value2 column.
Step 5: Combine the Charts Using hconcat
Now, we combine the two charts side by side using the hconcat function:
Python
# Combine the two charts using hconcat
combined_chart = alt.hconcat(
    chart1,
    chart2
).resolve_scale(
    color='independent'  # Ensure that the color scales are independent
).properties(
    title='Combined Chart with Two Different Legends'
)

combined_chart
Output:
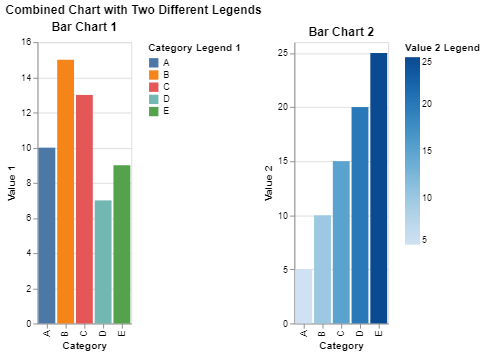 Combine the Charts Using hconcat
Explanation:
- alt.hconcat: This function concatenates two or more charts horizontally.
- resolve_scale: The color='independent' setting ensures that the color encodings in both charts are treated independently, allowing each chart to have its own color legend.
- color: The color encoding for each chart is based on different fields, which results in different legends.
Troubleshooting Common Issues
- Legend Not Displaying: Ensure that the
resolve_legend method is correctly applied and that each chart has a distinct encoding for the legend. - Overlapping Legends: Adjust the
orient property to position legends appropriately and avoid overlap. - Incorrect Legend Entries: Verify that each chart's
encode method specifies the correct field for the legend.
Conclusion
By using hconcat and resolve_scale, you can easily create side-by-side charts in Altair that each have their own independent legends. This technique is particularly useful when you need to compare different datasets or variables that require distinct visual encodings.