Setting a Custom Color Theme in Altair as Default
Last Updated :
23 Jul, 2025
Altair is a powerful declarative statistical visualization library for Python, based on Vega and Vega-Lite visualization grammars. It is widely used for creating interactive and visually appealing plots. One of the key features of Altair is its ability to customize visualizations, including setting custom color themes. This article will guide you through the process of setting a custom color theme in Altair as the default, ensuring that your visualizations maintain a consistent aesthetic.
Understanding Altair's Theming System
Before diving into customization, it's essential to understand Altair's theming system. Altair supports a variety of built-in themes, such as default, dark, and light.
- These themes define the overall look and feel of the charts, including colors, fonts, and other stylistic elements.
- However, you might want to create and use a custom theme to better match your project's branding or to achieve a specific visual style.
Getting Started with Color Themes
In Altair, themes define the overall look and feel of your visualizations, including color schemes, fonts, and other stylistic elements. By default, Altair comes with a few predefined themes like 'default' and 'none'.
Firstly, we will have to install altair_viewer, and then proceed with custom theme.
pip install altair_viewer
Then, add the following in your notebook:
Python
import altair_viewer
alt.renderers.enable('default')
Creating a Custom Color Theme
To create a custom color theme in Altair, you need to define a theme configuration that specifies the desired color scheme and other stylistic elements. Here's a step-by-step guide:
1. Define the Custom Theme
Create a Python function that returns a dictionary representing the theme configuration. This dictionary should include keys for various visual elements, such as colors, fonts, and chart properties.
# Define the custom theme
def my_custom_theme():
    return {
        "config": {
            "view": {"continuousWidth": 400, "continuousHeight": 300},
            "mark": {"color": "steelblue"},
            "axis": {
                "labelFontSize": 12,
                "titleFontSize": 14,
                "labelColor": "gray",
                "titleColor": "black"
            },
            "range": {
                "category": ["#1f77b4", "#ff7f0e", "#2ca02c", "#d62728", "#9467bd"]
            }
        }
    }
2. Check Altair’s Theme Registration
Ensure that the theme registration and enabling steps are correctly applied:
alt.themes.register('my_custom_theme', my_custom_theme)
alt.themes.enable('my_custom_theme')- If you miss enabling the theme, the default Altair theme will be used, and you won’t see your customizations.
- Ensure that the custom theme dictionary is correctly defined. If there’s a syntax error or incorrect property in the theme, Altair might ignore it silently.
Example: Creating a Bar Chart with a Custom Theme
Here's the complete code with the steps included to help you see the output:
Python
import altair as alt
import pandas as pd

# Define the custom theme
def my_custom_theme():
    return {
        "config": {
            "view": {"continuousWidth": 400, "continuousHeight": 300},
            "mark": {"color": "steelblue"},
            "axis": {
                "labelFontSize": 12,
                "titleFontSize": 14,
                "labelColor": "gray",
                "titleColor": "black"
            },
            "range": {
                "category": ["#1f77b4", "#ff7f0e", "#2ca02c", "#d62728", "#9467bd"]
            }
        }
    }

# Register and enable the custom theme
alt.themes.register('my_custom_theme', my_custom_theme)
alt.themes.enable('my_custom_theme')

# Sample data
data = pd.DataFrame({
    'Category': ['A', 'B', 'C', 'D', 'E'],
    'Value': [10, 15, 13, 17, 9]
})

# Create a bar chart
chart = alt.Chart(data).mark_bar().encode(
    x='Category',
    y='Value',
    color='Category'
)

# Display the chart
chart.show()
Output:
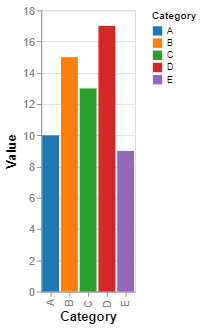 Bar Chart with a Custom Theme
Explanation for the above Example:
- Define a Custom Theme: The function
my_custom_theme() defines a custom theme for Altair charts. This theme specifies various configuration options such as:- Chart Size: Sets the continuous width to 400 pixels and the height to 300 pixels.
- Mark Color: Sets the default color of marks (such as bars, lines, etc.) to
steelblue. - Axis Configuration: Sets font sizes and colors for axis labels and titles.
- Category Color Range: Defines a color palette for categorical data.
- Register and Enable the Custom Theme:
alt.themes.register('my_custom_theme', my_custom_theme) registers the custom theme with the name 'my_custom_theme'.alt.themes.enable('my_custom_theme') activates the custom theme, meaning all subsequent charts will use this theme unless specified otherwise.
Advanced Customizations for Custom Color Theme
Altair allows for advanced customization beyond simple color schemes. Here are a few additional options you might consider:
- Custom Fonts: Specify custom fonts for text elements in your theme configuration.
- Axis and Grid Styling: Customize the appearance of axes and grid lines, including colors, line styles, and labels.
- Legend Customization: Adjust the position, orientation, and styling of legends to fit your design needs.
Troubleshooting Common Issues
While setting a custom theme in Altair is straightforward, you might encounter some common issues:
- Theme Not Applying: Ensure that the theme is registered and enabled before creating any charts. If a chart is created before enabling the theme, it won't use the custom settings.
- Color Scheme Errors: Double-check the color codes and ensure they are valid hex codes or recognized color names.
- Compatibility with Other Libraries: If you're using Altair with other visualization libraries, ensure there are no conflicts in styling or theme settings.
Conclusion
Setting a custom color theme in Altair as default is a powerful way to ensure consistency and branding across your visualizations. By following the steps outlined in this article, you can create visually appealing and cohesive charts that align with your project's aesthetic goals. Whether you're working on a data analysis project, a presentation, or a web application, Altair's theming capabilities offer the flexibility and control you need to create stunning visualizations.