Understanding Facet Wrap in Altair
Last Updated :
23 Jul, 2025
Faceting is a powerful tool in data visualization that allows for the creation of multiple small charts, each representing a subset of the data. In the context of Altair, a popular Python library for statistical graphics, achieving a multiple column/row facet wrap, similar to facet_wrap in ggplot2, has been a topic of interest for many users. This article will delve into the capabilities and limitations of Altair in creating such faceted plots, providing a step-by-step guide and examples to help users effectively utilize these features.
Background: Faceting in Data Visualization
Faceting involves dividing a dataset into subsets based on one or more variables and creating separate plots for each subset. This technique is invaluable for exploring and comparing different groups within the data. In ggplot2, the facet_wrap function makes it easy to create a grid of plots where the facets span multiple rows and columns. However, Altair's approach to faceting has evolved over time, and understanding these changes is crucial for effective use.
This technique is especially useful when visualizing how different categories behave across various dimensions. In many cases, visualizing data in a single row or column may not be sufficient.
- For example, when dealing with large datasets or numerous categories, plotting all facets in a single line can result in an unwieldy and difficult-to-read visualization.
- This is where the concept of multiple column/row facet wrap comes into play.
- By wrapping facets across multiple columns or rows, you can create a more organized and visually appealing grid layout.
Implementing Facet Wrap in Altair
Creating a Simple Faceted Plot
Before diving into multiple column/row facet wrap, let's review basic faceting in Altair. You can create a simple faceted plot by specifying either a row or column encoding channel:
Python
import altair as alt
from vega_datasets import data

iris = data.iris()

# Facet by species into rows
chart_row = alt.Chart(iris).mark_point().encode(
    x='petalLength:Q',
    y='petalWidth:Q',
    color='species:N'
).facet(
    row='species:N'
)

# Facet by species into columns
chart_column = alt.Chart(iris).mark_point().encode(
    x='petalLength:Q',
    y='petalWidth:Q',
    color='species:N'
).facet(
    column='species:N'
)
chart
Output:
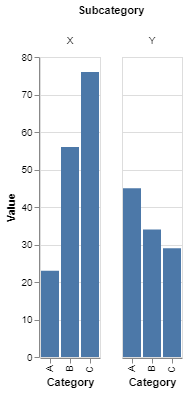 Facet Wrap in Altair
In this example, a simple bar chart is faceted by the Subcategory column, creating individual charts for each subcategory.
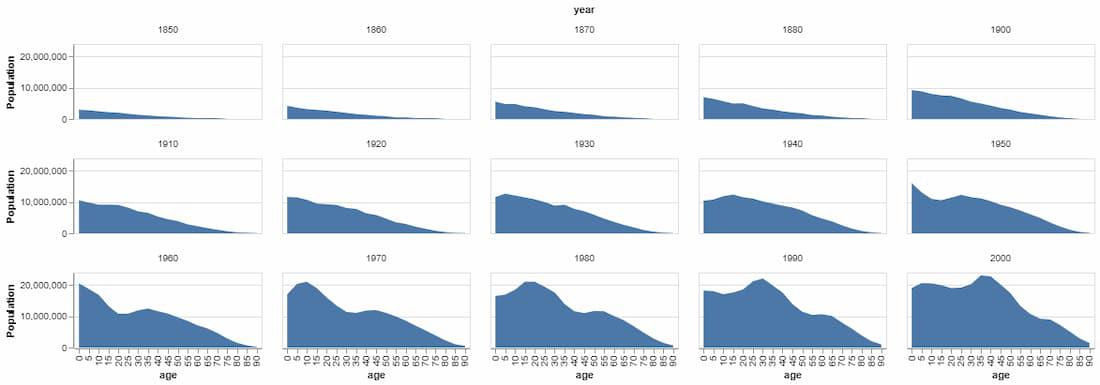
Multiple Column/Row Facet Wrap
To implement multiple column/row facet wrap in Altair, you need to specify both row and column encodings within the facet method. This allows you to create a grid layout where facets are distributed across both dimensions.
Python
import altair as alt
from vega_datasets import data

source = data.population.url

# Create a faceted chart with multiple columns
chart = alt.Chart(source).mark_area().encode(
    x='age:O',
    y=alt.Y('sum(people):Q', title='Population'),
    facet=alt.Facet('year:O', columns=5)  # Specify number of columns
).properties(
    width=200,
    height=80
)
chart
Output:
Customizing Facet Layouts
Altair provides several options for customizing the appearance and layout of faceted plots:
- Columns: You can specify the number of columns using the
columns parameter within the Facet object. This controls how many facets are displayed per row. - Alignment: The
align parameter allows you to control the alignment of grid rows and columns. Options include "all", "each", and "none", which determine whether subviews are aligned uniformly or allowed to vary in size. - Spacing: Adjust the spacing between facets using the
spacing parameter to improve readability. - Headers: Customize headers for each facet using the
header property, which allows for additional configuration such as title and label formatting
Conclusion
Multiple column/row facet wrap in Altair provides a powerful way to visualize complex datasets across multiple dimensions. By leveraging this feature, you can create organized and insightful visualizations that facilitate comparison and analysis.
Whether you're working with demographic data, sales figures, or scientific results, understanding how to implement and customize facet wraps will enhance your ability to communicate data-driven insights effectively.