Handling Missing Values in R Programming
Last Updated :
12 Jul, 2025
Missing values are those values that are not known and NA or NaN are reserved words that indicate a missing value in R Programming language. Missing values are practical in life for example, some cells in spreadsheets are empty and handling them is important for better analysis. In this article, we will learn how to handle missing values in R.
1. Using is.na() Function for Finding Missing values
A logical vector is returned by this function that indicates all the NA values present. It returns a Boolean value. If NA is present in a vector it returns TRUE else FALSE.
R
x<- c(NA, 3, 4, NA, NA, NA)
is.na(x)
Output:
[1] TRUE FALSE FALSE TRUE TRUE TRUE
We can also keep only the values which are available by discarding tNA or NaN values.
R
x <- c(1, 2, NA, 3, NA, 4)
d <- is.na(x)
x[! d]
Output:
[1] 1 2 3 4
3. Using Missing Value Filter Functions
In R many modeling functions have a na.action argument that defines how the function should handle missing values (NA). Depending on the chosen action the function applies one of the missing value filter functions. These functions modify the dataset by handling NA values in different ways.
The default missing value filter function is na.omit which removes any row that contains at least one NA.
Some common missing value filter functions are:
- na.omit: Removes rows containing any NA values.
- na.fail: Stops the function and throws an error if an NA value is encountered.
- na.exclude: Removes rows with NA values but retains their positions for later reference.
- na.pass: Ignores NA values and processes the data without any changes.
R
df <- data.frame (c1 = 1:8,
                  c2 = factor (c("B", "A", "B", "C",
                                 "A", "C", "B", "A")))

df[4, 1] <- df[6, 2] <- NA

levels(df$c2)

na.fail(df)

na.exclude(a)
Output:
[1] "A" "B" "C"
Error in na.fail.default(df) : missing values in object
Calls: na.fail -> na.fail.default
Execution halted
Finding and Removing NA or NaN values from a Dataset
In R we can remove and find missing values from the entire dataset and here's how we can perform it.
1. Creating Sample Data
First we will create one data frame containing NA values.
R
data <- data.frame(
  A = c(1, 2, NA, 4, 5),
  B = c(NA, 2, 3, NA, 5),
  C = c(1, 2, 3, NA, NA)
)

data
Output:
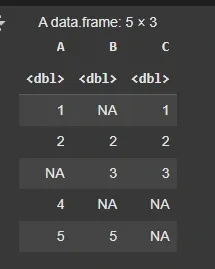 Sample Data
2. Find all the missing values in the data
We will find all the missing values which are present in the data using the is.na() function.
R
Output:
[1] 5
3. Find all the missing values in the columns
We will find missing values which are present in the data column wise. We will use colSums() function to display the number of NA values in each column.
R
x <- colSums(is.na(data))
x <- as.data.frame(x)
x
Output:
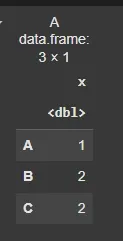 Find all the missing values in the columns
4. Visualizing missing values
We will visualize the NA values using the visdat package in R. The vis_miss() function will plot a diagram representing the missing and present values.
R
install.packages("visdat")
library(visdat)

data <- data.frame(
  A = c(1, NA, 3, NA, 5),
  B = c(NA, 2, NA, 4, NA),
  C = c(1, 2, 3, NA, NA)
)

vis_miss(data)
Output:
 Handling missing values in R
5. Removing missing values
We will remove the outliers using the na.omit() function.
R
data<- na.omit(data)

data
Output:
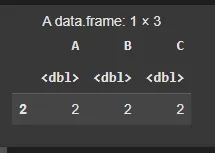 Removing missing values