How to Get Percentage in Excel: Quick Steps
- Select the Cell for the Result
- Enter the Formula>>Press Enter
- Format as Percentage
Did you know that 90% of businesses rely on Excel for data analysis, and percentage calculations are one of the most frequently used features? Whether you’re tracking sales growth, analyzing expenses, or comparing performance metrics, knowing how to calculate percentage in Excel is a must-have skill. But if you’re still doing it manually or struggling with formulas, you’re missing out on Excel’s powerful tools.
In this Excel percentage tutorial, we’ll show you how to calculate percentages in Excel with clear, step-by-step instructions and practical examples. From basic calculations to advanced techniques like percentage increase or decrease, this guide covers everything you need to know. You’ll learn the Excel percentage formula, how to use cell references, and even how to automatically calculate percentages. Whether you’re a beginner or looking to refine your skills, this guide will help you master percentage calculation in Excel with examples.

What is a Percentage and Why Use it in Excel
Excel provides several easy methods for calculating percentages. The most common approach involves using a simple formula: (Part/Whole)100. For instance, to find the percentage of a value (Part) within a total (Whole), you can enter the formula "=A1/B1*100" in a cell, where A1 holds the Part value and B1 holds the Whole value. Alternatively, Excel offers built-in functions like PERCENTAGE, which directly calculates the percentage of a value within a given range.
Why Use Percentages in Excel
- Quick Calculations: Excel makes it easy to calculate percentages for things like discounts, growth rates, or test scores.
- Data Analysis: Percentages help compare data, like showing how much sales increased from one month to another.
- Clear Visualization: You can format numbers as percentages in Excel, making your data easier to read and understand.
(Part/Whole)*100 = Percentage
How to Calculate Percentage in Excel: Step-by-Step Guide
Calculating percentages in Excel is simple and efficient, especially when you use the percentage of formula in Excel. To make it easier to understand, we have provided three examples that show how to calculate percentages in different ways.
Example 1: Basic Percentage Calculation
Suppose you have some student data in columns A, B and C. Follow the procedures below to determine the percentage of marks obtained.
In column D2, enter the Excel percentage formula =C2/B2, and then duplicate it across as many rows as necessary.
To show the resulting decimal fractions as percentages, select the Percent Style button (Home tab > Number group) OR Press CTRL+SHIFT+% on the keyboard.

Example 2: Calculate a Percentage of a Number
For example, suppose we want to calculate 20% of 200. Type the following formula into an Excel cell:
For the data and condition specified enter the formula in the cell.
= 20% * 200
.webp)
Step 2: Percentage Calculated
Now you will see that it automatically calculate the percentage and brings out the output. 40.
.webp)
Example 3: Calculate Percentage Using Cell References
Instead of using direct numerical values, we can reference other cell values. For instance, if we have a cell containing an employee's salary and want to calculate their PF contribution (which is 12% of the salary), we can proceed as follows:
For example, suppose the A2 cell contains salary, and we want the pf contribution amount in the B2 cell
.webp)
Step 1: Use the Cell Reference
Replace the number with the cell reference that contains the value from which the percentage needs to be calculated.

Step 2: Calculate the Percentage
To calculate the PF contribution, multiply the salary by 12% (or 0.12).
Step 3: Preview Results
Press Enter and Preview Results.

How to Automatically Calculate Percentage in Excel
Excel provides built-in features and formulas to perform mathematical operations, including percentage calculations. Here's how to calculate the percentage of students' marks step by step:
Now let's consider an example where you can calculate the percentage of students' Marks.
.webp)
Step 1: Calculate Total Marks Obtained
Enter the formula to sum up marks from different subjects:
=B2+C2+D2
Replace B2, C2, and D2 with the respective cell references containing the marks of individual subjects.
The result will be displayed in a new column (e.g., Total Marks in column E).
Step 2: Calculate Percentage
Enter the formula to calculate the percentage:
=E2/F2
- E2: Total Marks obtained.
- F2: Total Maximum Marks (e.g., 300 for 3 subjects with 100 marks each).
- Select the cells with the percentage formula.
- Go to the Home tab and click the Percent Style (%) button in the Number group.
- This will format the values as percentages automatically.

Advanced Percentage Calculations in Excel
In this section of How to Calculate Percentage in Excel ], we’ll cover more advanced ways to work with percentages. These methods help you handle more complex data, like comparing numbers, tracking changes over time, and ensuring accurate calculations using absolute references.
We have provided three simple examples to show you how to use these advanced percentage formulas in Excel.
Example 1: Calculating Total Percentage with Absolute References
Let’s explore how to quickly calculate a percentage of a total in Excel for different data sets.
If the Total is at the End of the Table in a Cell
The key difference in this scenario is using an absolute reference for the total value in the denominator. This means adding a $ symbol to lock the reference when copying the formula to other cells.
Step 1: Use Method
Use the following method to determine percentages of the total if, for instance, some values are in column B and their sum is in cell B7:
Use "=B2/$B$7", Because you want to keep the denominator at B7, input $B$7 as an absolute cell reference.
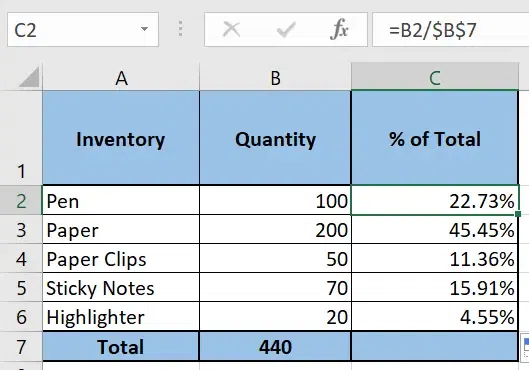
In the below example, the Percentages of Total column has a percentage style with two decimal places visible.
Example 2: Calculating Percentage Increase or Decrease
A percent change formula is probably the one you would use the most frequently out of all the Excel formulas for determining percentages so here we will calculate percentage change on excel.
The general formula is as follows, to determine the percentage difference between two numbers, X and Y:
Percent Change = (Y - X) / X
It's crucial that you properly identify which value corresponds to X and which to Y when using this formula with actual data.
For example, yesterday you had 100 Sticky Notes, and now you have 120, meaning that now you have 20 Sticky Notes more than before, which is a 20% increase.
Considering the above example, the Percentage of Variation Formula in Excel can be re-written as:
Percentage of Variation = (New Price - Old Price) / Old Price
Calculating the Month's Percent Difference Between 2 columns
Suppose you have last month's inventory in column B and this month's inventory in column C. Use the below formula to calculate the Percentage Change/Variation
Use the Formula "=(C2-B2)/B2" in the Cell.
In column D2, enter the formula =(C2-B2)/B2, Click the Percent Style button on the Home tab to convert the decimal number to a percentage
Then duplicate the formula across as many rows as necessary
Step 4: Percentage Calculated
As a result, the formula calculates the percentage of change in this month (column C) compared to last month (column B). Here, negative percentages (percent decline) are formatted in red, while positive percentages (percent increase) are formatted in black.

Example 3: Calculating Percentage Difference Between Two Numbers
The percentage difference between two numbers shows how much one number has changed in relation to another. It is calculated using the formula:
Percentage Difference = ((New Value - Old Value) / Old Value) * 100
If you have a single column of numbers, such as column C, which shows quarterly sales, you can use the following formula to determine the percentage difference between the previous quarter and the current quarter:
=(B3-B2)/B2

Here, negative percentages (percent decline) are formatted in red, while positive percentages (percent increase) are formatted in black.
Excel provides simple formulas to increase or decrease a number by a specific percentage. Here’s how to apply them:
For Percentage Increase:
To increase an amount by a percentage, use the following formula:
= Amount * (1 + %)
Example:
To increase the value in cell A1 by 50%, use:
=A1*(1+50%)
For Percentage Decrease:
To decrease an amount by a percentage, use this formula:
= Amount * (1 - %)
Example:
To decrease the value in cell A1 by 50%, use:
=A1*(1-50%)
If A2 contains your current profit and B2 holds the percentage by which you want to increase or decrease the amount, you can use these formulas in C2:
Increase by Percentage:
=A2*(1+B2)

Decrease by Percentage:
=A2*(1-B2)

Note: Make sure the percentage in B2 is formatted correctly (e.g., enter 50% or 0.5 for 50%).
Conclusion
Mastering how to calculate percentage in Excel is a game-changer for anyone working with data. From simple percentage calculations to advanced techniques like percentage increase or decrease, Excel’s tools and formulas make it easy to analyze and present your findings. With the Excel percentage formula and the examples provided, you’ll be able to handle any percentage-related task with confidence.
Ready to take your Excel skills to the next level? Start applying these techniques today and see how much easier your data analysis can become. Whether you’re a student, professional, or casual user, this Excel percentage tutorial is your go-to resource for all things percentages.
How to Calculate a Percentage in Excel
How to Calculate the Percentage from Values in Multiple Rows?
To calculate the percentage from multiple rows, divide the sum of a subset of rows by the total sum of all rows and multiply by 100. For example, use the formula:
=SUM(A1:A3)/SUM(A1:A10)*100
The easiest Excel percentage formula is "(part/total)*100. This formula is used without the (*100). This is because when the percentage format is selected, the resulting number automatically changed to percent.
Follow the step given below to calculate percentage formula in Excel multiple cells:
- Select the Cell for the Result
- Enter the Formula
- Format as Percentage
For student percentage formula follow the given steps:
- Enter Total Marks
- Enter the Formula
- Format as Percentage
How to calculate percentage in Excel between two cells?
Here are the following steps:
- Select the Cell for the Result
- Use the formula = ((New_Value - Old_Value) / Old_Value) * 100
- Format as Percentage
The formulas for average and percentage in Excel are:
- Use the formula =AVERAGE(A1:A10)
- Use the formula =(A1 / SUM(A1:A10)) * 100
Similar Reads
How To Calculate Average Percentage with Examples
To calculate an average percentage, you first add up all the individual percentages you want to average. Then, divide that total by the number of percentages you added together. This gives you the average. For example, if you have three percentages like 70%, 80%, and 90%, you add them up (240) and t
2 min read
How to Use Goal Seek in Excel with Examples: A Complete Guide
Excel Function Goal Seek : Quick StepsSet Up Your DataGo to Data Tab>>Select What-if-AnalysisFill Out the Goal Seek Dialog BoxRun Goal Seek>>Review the ResultsDo you find yourself stuck trying to solve “what-if†scenarios in Excel? Whether it’s calculating loan payments, determining sale
9 min read
How to use Copilot in Excel with Examples (Step-by-Step Guide)
As of 2024, Microsoft introduced a new feature called Copilot for Excel, part of the broader Microsoft 365 suite, designed to enhance productivity and streamline data manipulation using AI-powered tools. The introduction of Excel Copilot is transforming how professionals across industries manage and
9 min read
How to Calculate Mean Absolute Percentage Error in Excel?
In statistics, we often use Forecasting Accuracy which denotes the closeness of a quantity to the actual value of that particular quantity. The actual value is also known as the true value. It basically denotes the degree of closeness or a verification process that is highly used by business profess
2 min read
How to Calculate Relative Standard Deviation in Excel?
Definition: Related standard deviation is also known as the relative percentage standard deviation form, the deviation measurement which tells us how different numbers are dispersed around the mean in a particular set of data. This format shows the percentage distribution of data. If a relative stan
2 min read
How to Calculate Running Total in Excel?
Excel is a tool widely used by professionals for financial data or trend analysis but can be used for different purposes. It is used for various data visualization purposes. It simplifies data management and data evaluation which uses spreadsheets for managing, storing, and visualizing large volumes
2 min read
How to Calculate Weighted MAPE in Excel?
In statistics, we often use Forecasting Accuracy which denotes the closeness of a quantity to the actual value of that particular quantity. The actual value is also known as the true value. It basically denotes the degree of closeness or a verification process that is highly used by business profess
3 min read
How to Calculate Percentage by Group in R
In R Programming Language Percentage by group refers to calculating the proportion or percentage of a certain subgroup within a larger group. This is often used in statistics or data analysis to understand the distribution of data across different categories or groups.Calculation of the percentage b
4 min read
How to Calculate the Midrange in Excel?
MS Excel is a spreadsheet developed by the company Microsoft. Excel provides various kinds of functions and we can insert the data in form of rows and columns and perform operations on the data and yield the results we desired. The Midrange of the dataset in other terms can be specified as average o
2 min read
How to Show Percentage in Pie Chart in Excel?
Pie charts are mostly used as it is more appealing and easy to understand for any type of audience. It is divided into various parts and each part of pie charts denotes a subcategory of the original data set. This sub-category data is sometimes shown using the original values or sometimes using perc
2 min read