How to Calculate Partial Correlation Matrix With Excel VBA?
Last Updated :
13 Jun, 2023
Correlation is the way to measure the relation between two variables. The value of the correlation lies between -1 to 1. If the value is greater than 0 then both the values are positively correlated, if the value of the correlation is 0 then there is no such relation between the two variables and if the value is less than 0 then the two values are negatively correlated.
Partial Correlation is used to measure the relationship between two different variables by eliminating the third variable. The partial correlation matrix calculates the coefficients of partial correlation of a matrix. In the partial correlation matrix row i and column j have a partial correlation with the row i and column j of the original matrix. In this article, we will discuss calculating a partial correlation matrix in Excel VBA.
Following are the steps to calculate the partial correlation matrix with Excel VBA are:
Step 1: Given sample data, which has 5 columns named V1, V2, V3, and V4. Each column has 7 rows, with different numbers in it.

Step 2: Before calculating the partial correlation matrix, we need to calculate the correlation matrix for the given data. Make a new table, where H4 = V1, I4 = V2, J4 = V3, and K4 = V4. Similarly, G5 = V1, G6 = V2, G7 = V3, and G8 = V4.

Step 3: Enter the following formula in the H5 cell to calculate the correlation of the variables. We have an in-built function in Excel, to calculate the correlation matrix i.e. =correl(array1, array2). Now, we have to pass arguments, in the correl function, which can easily be achieved using the offset function, as it takes a range of elements.
=CORREL(OFFSET($A$2:$A$8, ,ROWS($1:1)-1),OFFSET($A$2:$A$8, ,COLUMNS($A:A)-1))

Step 4: After getting the correlation for the V1 row and column, drag the cell from H5 to K8. The same formula as in H5, will be copied to all other cells.

Step 5: For calculating the partial correlation matrix we need to first create a table. Make a new table, where O4 = V1, P4 = V2, Q4 = V3, and R4 = V4. Similarly, N5 = V1, N6 = V2, N7 = V3, and N8 = V4. Then, press Alt + F11 to get the VBA Code Editor.

Step 6: Click on the Insert tab and select Module.

Step 7: Enter the following code in the Module to calculate the Partial Correlation matrix. Knowing the working of the code is not so important, because this is a general code, and can work for any table. After adding the code, close the VBA window.
Option Explicit
Function Partial_Cor(R)
Dim row As Integer, col As Integer
Dim ident() As Double, rowDiag() As Double, rowDiagSQRT() As Double,
Part_Corr() As Double, Negative_Cor As Variant, rowinverse As Variant
Dim i As Integer, j As Integer
row = R.row.Count
col = R.Columns.Count
rowinverse = Application.Minverse(R)
ReDim ident(1 To row, 1 To col)
ReDim rowDiag(1 To row, 1 To col)
ReDim rowDiagSQRT(1 To row, 1 To col)
ReDim Part_Corr(1 To row, 1 To col)
For i = 1 To row
For j = 1 To col
ident(i, j) = 0
rowDiag(i, j) = 0
if i = j Then
ident(i, j) = 1
rowDiag(i, j) = 1 / rowinverse(i, j)
rowDiagSQRT(i, j) = rowDiag(i, j) ^ 0.5
End if
Next j
Next i
Negative_Cor= (Application.MMult(rowDiagSQRT, Application.MMult(rowinverse, rowDiagSQRT)))
For i = 1 To row
For j = 1 To col
Part_Corr(i, j) = ident(i, j) - Neg_Cor(i, j)
Part_Corr(i, i) = -1
Next j
Next i
Partial_Cor = Part_Corr
End Function
Step 8: Now, select the cells, from range O5:R8.

Step 9: As we can see in the VBA code, the name of the function is Partial_Cor. Enter =Partial_Cor(H5:K8) in the O5 cell and then click Ctrl+Shift+Enter.
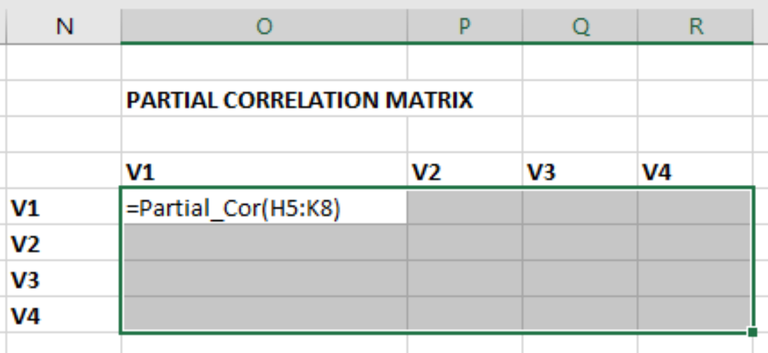
Step 10: We will get the Partial Correlation Matrix.

Similar Reads
How to Calculate Partial Correlation in Excel? Partial correlation helps find the correlation between the two variables by removing the effect of the third variable. There can be situations when the relations between variables can be many. This could reduce the accuracy of correlation or could also give wrong results. Partial correlation removes
5 min read
How to Calculate Partial Correlation in R? In this article, we will discuss how to calculate Partial Correlation in the R Programming Language. Partial Correlation helps measure the degree of association between two random variables when there is the effect of other variables that control them. in partial correlation in machine learning It g
3 min read
How to Calculate Spearman Rank Correlation in Excel? We have noticed a general trend that with an increase in the height of a person, its weight also increases. This happens because there is a positive correlation between height and weight. As one variable increases, the other one also increases, but with this, we only get the quality measure of the d
8 min read
How to Calculate Correlation in R with Missing Values When calculating correlation in R, missing values are excluded by default using a method called pairwise deletion. This means R ignores any observation where a variable in the pair is missing.How to Calculate Correlation in R with Missing ValuesThere are several ways to calculate correlation in R wh
3 min read
How to Calculate Point-Biserial Correlation in Excel? The Point-Biserial Correlation Coefficient is a correlation metric that measures the degree of relationship between a continuous and a binary variable. The connection between a binary variable, x, and a continuous variable, y, is measured using point-biserial correlation. Binary variables are widely
3 min read
How to Calculate Correlation in Excel: Step by Guide Understanding the relationship between two variables is essential in data analysis, and correlation is a powerful statistical tool to measure that relationship. Excel, as a versatile data analysis tool, allows you to calculate correlation easily. In this article, you will learn the different methods
8 min read