Draw Horizontal Lines on Chart.js
Last Updated :
23 Jul, 2025
Horizontal Lines on Chart.js are a useful way to enhance data visualization by providing reference lines at specific values across the chart. These lines can help highlight thresholds, targets, or significant data points, making it easier for users to interpret the data. In this article, we will explore two different approaches to Draw horizontal lines on Chart.js.
Chart.js CDN link
<script src="https://cdnjs.cloudflare.com/ajax/libs/Chart.js/3.7.0/chart.min.js"></script>
These are the following approaches:
Approach 1: Using Plugin To draw a Horizontal Line
In this approach, we are using a custom Chart.js plugin to draw a horizontal line at a specific y-value on the chart. The plugin, defined as horizontalLinePlugin, uses the afterDraw hook to access the chart's canvas context and draw the line across the chart area.
Example: The below example uses plugin to Draw a Horizontal Line.
HTML
<!DOCTYPE html>

<head>
    <title>Example 1</title>
    <style>
        body {
            font-family: Arial, sans-serif;
        }

        h1 {
            color: green;
            text-align: center;
        }

        h3 {
            margin-top: 0;
            text-align: center;
        }

        .chart-container {
            position: relative;
            width: 300px;
            height: 500px;
            margin: auto;
        }
    </style>
</head>

<body>
    <h1>GeeksforGeeks</h1>
    <h3>Approach 1: Using Plugin to Draw Horizontal Line</h3>
    <div class="chart-container">
        <canvas id="chart1"></canvas>
    </div>
    <script src=
 "https://cdnjs.cloudflare.com/ajax/libs/Chart.js/3.7.0/chart.min.js">
    </script>
    <script>
        const ctx1 = document.getElementById('chart1').getContext('2d');

        const horizontalLinePlugin = {
            id: 'horizontalLine',
            afterDraw: (chart) => {
                const yValue = chart.scales.y.getPixelForValue(50);
                const ctx = chart.ctx;
                ctx.save();
                ctx.beginPath();
                ctx.moveTo(chart.chartArea.left, yValue);
                ctx.lineTo(chart.chartArea.right, yValue);
                ctx.strokeStyle = 'red';
                ctx.lineWidth = 2;
                ctx.stroke();
                ctx.restore();
            }
        };

        const chart1 = new Chart(ctx1, {
            type: 'bar',
            data: {
                labels: ['HTML', 'CSS', 'JavaScript', 'Python'],
                datasets: [{
                    label: 'GeeksforGeeks Tutorials',
                    data: [30, 50, 70, 40],
                    backgroundColor: ['red', 'blue', 'green', 'purple']
                }]
            },
            options: {
                responsive: true,
            },
            plugins: [horizontalLinePlugin]
        });
    </script>
</body>

</html>
Output:
 Approach 1: Output
Approach 2: Using Custom Annotations
In this approach, we are using the animation.onComplete callback within Chart.js to draw a horizontal line after the chart animation completes. This method involves accessing the chart's canvas context and drawing the line manually at a specific y-value, using the setLineDash method to create a dashed effect.
Example: The below example uses Custom Annotations to Draw a Horizontal Line.
HTML
<!DOCTYPE html>

<head>
    <title>Example 2</title>
    <style>
        body {
            font-family: Arial, sans-serif;
        }

        h1 {
            color: green;
            text-align: center;
        }

        h3 {
            margin-top: 0;
            text-align: center;
        }

        .chart-container {
            position: relative;
            width: 300px;
            height: 300px;
            margin: auto;
        }
    </style>
</head>

<body>
    <h1>GeeksforGeeks</h1>
    <h3>Approach 2: Using Custom Annotations</h3>
    <div class="chart-container">
        <canvas id="chart1"></canvas>
    </div>
    <script src=
 "https://cdnjs.cloudflare.com/ajax/libs/Chart.js/3.7.0/chart.min.js">
    </script>
    <script>
        const ctx1 = document.getElementById('chart1').getContext('2d');
        const chart1 = new Chart(ctx1, {
            type: 'line',
            data: {
                labels: ['January', 'February', 'March', 'April', 'May'],
                datasets: [{
                    label: 'GeeksforGeeks Views',
                    data: [65, 59, 80, 81, 56],
                    borderColor: 'blue',
                    fill: false,
                }]
            },
            options: {
                responsive: true,
                plugins: {
                    tooltip: {
                        enabled: true
                    }
                },
                scales: {
                    y: {
                        beginAtZero: true
                    }
                },
                animation: {
                    onComplete: function () {
                        const chartInstance = chart1;
                        const yScale = chartInstance.scales.y;
                        const ctx = chartInstance.ctx;
                        ctx.save();
                        ctx.strokeStyle = 'red';
                        ctx.lineWidth = 2;
                        ctx.setLineDash([5, 5]);
                        ctx.beginPath();
                        ctx.moveTo(chartInstance.chartArea.left, yScale.getPixelForValue(70));
                        ctx.lineTo(chartInstance.chartArea.right, yScale.getPixelForValue(70));
                        ctx.stroke();
                        ctx.restore();
                    }
                }
            }
        });
    </script>
</body>

</html>
Output
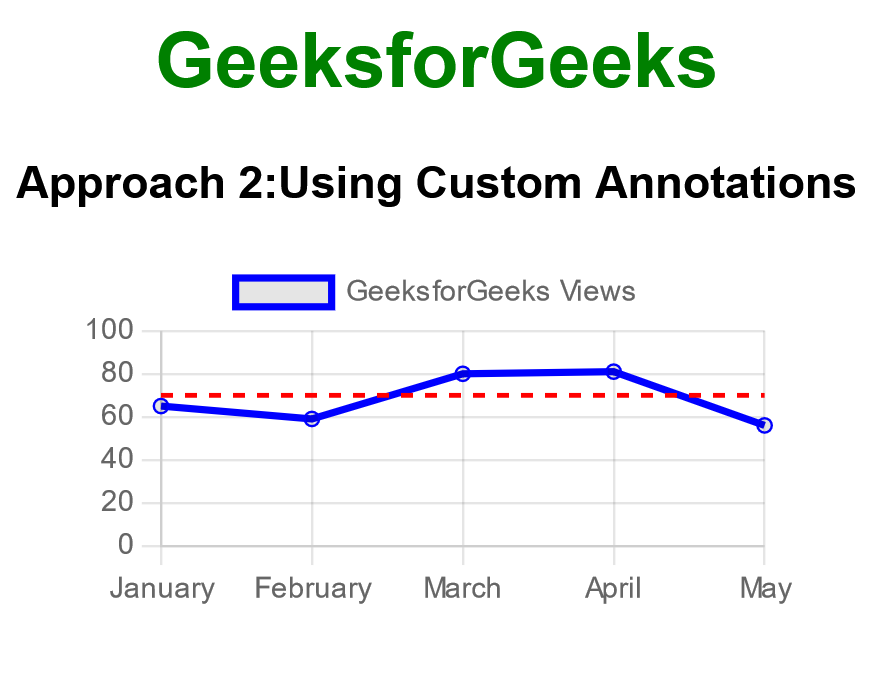 Approach 2: Output
Explore
HTML Basics
Structure & Elements
Lists
Visuals & Media
Layouts & Designs
Projects & Advanced Topics
Tutorial References