How To Remove Line Chart Fill in ChartJS?
Last Updated :
23 Jul, 2025
In Chart.js, the fill property for Line Chart allows you to control whether the area under the line is filled with color. By default, this property is set to true, which means the area below the line is filled.
However, you might want to remove this fill for a cleaner look or to highlight only the line itself. This can be done using different approaches, such as setting the background colour to transparent or explicitly configuring the fill property to false.
Chart.js CDN link
<script src="https://cdnjs.cloudflare.com/ajax/libs/Chart.js/3.7.0/chart.min.js"></script>
These are the following approaches:
Approach 1: Removing Fill Using 'fill: false'
In this approach, we are using the fill: false property in the dataset configuration to remove the fill under the line in the Line Chart. This ensures that only the line representing the data is visible, without any area beneath it being shaded.
Syntax:
const config = {
    type: 'line',
    data: {
        // dataset
    },
    options: {
        responsive: true,
        elements: {
            line: {
                fill: false // Disables fill under the line
            }
        }
    }
};
Example: The example below uses fill: false to remove the fill in the Line Chart.
HTML
<!DOCTYPE html>
<head>
    <title>
       Example 1
    </title>
    <script src=
"https://cdnjs.cloudflare.com/ajax/libs/Chart.js/3.7.0/chart.min.js">
    </script>
    <style>
  body {
            display: flex;
            flex-direction: column;
            align-items: center;
            justify-content: center;
            min-height: 100vh;
            margin: 0;
            font-family: Arial, sans-serif;
        }

        h1 {
            color: green;
        }

        canvas {
            max-width: 400px;
            max-height: 300px;
            width: 100%;
            height: auto;
        }
    </style>
</head>
<body>
    <h1>
  GeeksforGeeks
    </h1>
    <h3> Approach 1: Removing Fill Using `fill: false` </h3>
    <canvas id="lineChart1">
    </canvas>
    <script>
  const data1 = {
            labels: ['January', 'February', 'March', 'April', 'May'],
            datasets: [{
                label: 'Website Traffic',
                data: [1200, 1900, 3000, 5000, 2300],
                borderColor: '#4caf50',
                backgroundColor: '#4caf50',
                fill: false,
                tension: 0.4
            }]
        };

        const config1 = {
            type: 'line',
            data: data1,
            options: {
                responsive: true,
                scales: {
                    x: {
                        beginAtZero: true
                    },
                    y: {
                        beginAtZero: true
                    }
                }
            }
        };

        const lineChart1 = new Chart(
            document.getElementById('lineChart1'),
            config1
        );
    </script>
</body>
Output
 Approach 1: Output
Approach 2: Removing Fill by Setting 'backgroundColor' to 'transparent'
In this approach, we are using the backgroundColor property set to 'transparent' to remove the fill from the line chart. This makes sure that only the line itself is visible without any area fill underneath it, resulting in a clear and focused presentation of the data points. The tension: 0.4 property is optionally added to smooth out the lines for a more polished look.
Syntax:
const data = {
    labels: ['Label1', 'Label2', 'Label3'],
    datasets: [{
        label: 'Dataset Label',
        data: [10, 20, 30],
        borderColor: '#ff0000',  // Line color
        backgroundColor: 'transparent',  // Transparent background to remove fill
        tension: 0.4  // Optional: Smooth lines
    }]
};
Example: The below example removes fill from Line Chart by setting 'backgroundColor' to 'transparent'.
HTML
<!DOCTYPE html>
<head>
    <title>
     Example 2
    </title>
    <script src=
"https://cdnjs.cloudflare.com/ajax/libs/Chart.js/3.7.0/chart.min.js">
    </script>
    <style>
  body {
            display: flex;
            flex-direction: column;
            align-items: center;
            justify-content: center;
            min-height: 100vh;
            margin: 0;
            font-family: Arial, sans-serif;
        }

        h1 {
            color: green;
        }

        canvas {
            max-width: 400px;
            max-height: 300px;
            width: 100%;
            height: auto;
        }
    </style>
</head>
<body>
    <h1>
  GeeksforGeeks
    </h1>
    <h3> Approach 2: Removing Fill by Setting `backgroundColor` to `transparent` </h3>
    <canvas id="lineChart2">
    </canvas>
    <script>
  const data3 = {
            labels: ['Python', 'Java', 'C++', 'JavaScript', 'PHP'],
            datasets: [{
                label: 'Popular Programming Languages',
                data: [80, 60, 70, 90, 50],
                borderColor: '#2196f3',
                backgroundColor: 'transparent',
                fill: true,
                tension: 0.4
            }]
        };

        const config3 = {
            type: 'line',
            data: data3,
            options: {
                responsive: true,
                scales: {
                    x: {
                        beginAtZero: true
                    },
                    y: {
                        beginAtZero: true
                    }
                }
            }
        };

        const lineChart2 = new Chart(
            document.getElementById('lineChart2'),
            config3
        );
    </script>
</body>
Output
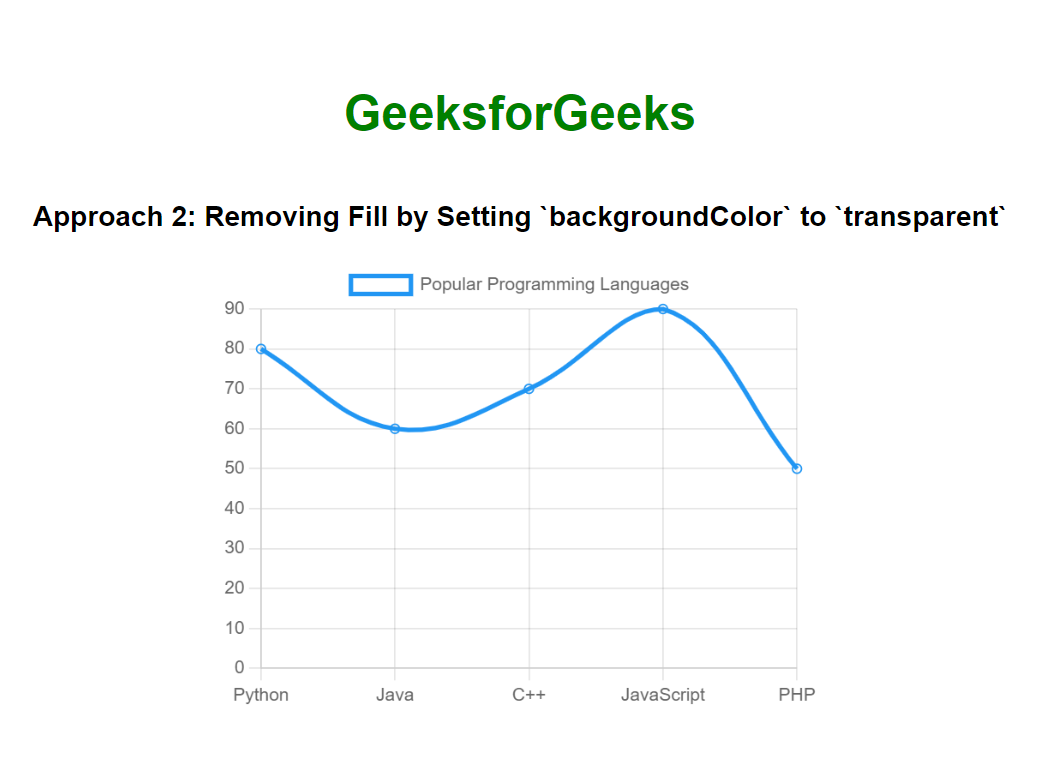 Approach 2: Output
Explore
HTML Basics
Structure & Elements
Lists
Visuals & Media
Layouts & Designs
Projects & Advanced Topics
Tutorial References