Handling Missing Values in Machine Learning
Last Updated :
03 Dec, 2025
Missing values appear when some entries in a dataset are left blank, marked as NaN, None or special strings like "Unknown". If not handled properly, they can reduce accuracy, create bias and break algorithms that require complete data.
- Keeps models accurate
- Prevents bias
- Maintains sample size
- Allows correct use of ML algorithms
 Missing Values
Reasons Behind Missing Values in the Dataset
Data can be missing from a dataset for several reasons and understanding the cause is important for selecting the most effective way to handle it. Common reasons for missing data include:
- Technical issues: Failed data collection or errors during data transmission.
- Human errors: Mistakes like incorrect data entry or oversights during data processing.
- Privacy concerns: Missing sensitive or personal information due to confidentiality policies.
- Data processing issues: Errors that occur during data preparation.
By identifying the reason behind the missing data, we can better assess its impact whether it's causing bias or affecting the analysis and select the proper handling method such as imputation or removal.
Types of Missing Values
- MCAR (Missing Completely at Random): Missingness occurs randomly and is not related to any variable in the dataset.
- MAR (Missing at Random): Missingness depends on other observed variables, not on the missing value itself.
- MNAR (Missing Not at Random): Missingness is directly related to the value that is missing (e.g., high-income individuals not reporting income).
Methods for Identifying Missing Data
Detecting and managing missing data is important for data analysis. Let's see some useful functions for detecting, removing and replacing null values in Pandas DataFrame.
Functions | Descriptions |
|---|
.isnull() | Detect missing values |
.notnull() | Detect non-missing values |
.info() | Summary with missing counts |
.isna() | Same as isnull(). |
| dropna() | Remove missing rows/columns |
| fillna() | Fill missing values |
| replace() | Replace specific values |
| drop_duplicates() | Remove duplicate rows |
| unique() | Get unique values in a Series/DataFrame |
For more detail refer to Working with Missing Data in Pandas
Representation of Missing Values in Datasets
Missing values can appear in different forms, so using a consistent and well-documented format is important for clean data handling.
Common representations include:
- Blank cells: Empty entries in spreadsheets or CSV files.
- Special values: Placeholders like "NA", "NaN", "NULL" or numbers such as -999.
- Codes or flags: Labels like "MISSING" or "UNKNOWN" to indicate specific types of missing data.
Strategies for Handling Missing Values in Data Analysis
Depending on the nature of the data and the missingness, several strategies can help maintain the integrity of our analysis. Let's see some of the most effective methods to handle missing values.
Creating a Sample Dataframe
Here we will be using Pandas and Numpy libraries.
Python
import pandas as pd
import numpy as np
data = {
'School ID': [101, 102, 103, np.nan, 105, 106, 107, 108],
'Name': ['A', 'B', 'C', 'D', 'E', 'F', 'G', 'H'],
'Address': ['123 Main St', '456 Oak Ave', '789 Pine Ln', '101 Elm St', np.nan, '222 Maple Rd', '444 Cedar Blvd', '555 Birch Dr'],
'City': ['Mumbai', 'Delhi', 'Bengaluru', 'Chennai', 'Kolkata', np.nan, 'Pune', 'Jaipur'],
'Subject': ['Math', 'English', 'Science', 'Math', 'History', 'Math', 'Science', 'English'],
'Marks': [85, 92, 78, 89, np.nan, 95, 80, 88],
'Rank': [2, 1, 4, 3, 8, 1, 5, 3],
'Grade': ['B', 'A', 'C', 'B', 'D', 'A', 'C', 'B']
}
df = pd.DataFrame(data)
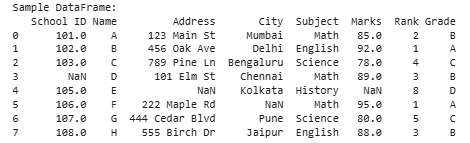
print("Sample DataFrame:")
print(df)
Output:
 Creating a Sample Dataframe
1. Removing Rows with Missing Values
Removing rows with missing entries is the simplest way to handle missing data. It keeps the dataset clean but may reduce sample size and introduce bias if missingness is not random.
In this example, we are removing rows with missing values from the original DataFrame (df) using the dropna() method and then displaying the cleaned DataFrame (df_cleaned).
Python
df_cleaned = df.dropna()

print("\nDataFrame after removing rows with missing values:")
print(df_cleaned)
Output:
 Removing Rows with Missing Values
Pros: simple, quick, results in a fully complete dataset
Cons: loss of data, possible bias
2. Imputation Methods
Imputation replaces missing values with estimated values to preserve the dataset’s size. However, the filled values may not always represent the true data.
1. Mean, Median and Mode Imputation: This method involves replacing missing values with the mean, median or mode of the relevant variable. It's a simple approach but it doesn't account for the relationships between variables.
Python
mean_imputation = df['Marks'].fillna(df['Marks'].mean())
median_imputation = df['Marks'].fillna(df['Marks'].median())
mode_imputation = df['Marks'].fillna(df['Marks'].mode().iloc[0])
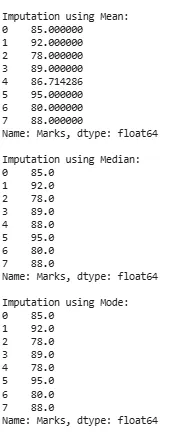
print("\nImputation using Mean:")
print(mean_imputation)
print("\nImputation using Median:")
print(median_imputation)
print("\nImputation using Mode:")
print(mode_imputation)
Output:
 Mean, Median and Mode Imputation
Explanation: In this example, we are explaining the imputation techniques for handling missing values in the 'Marks' column of the DataFrame (df). It calculates and fills missing values with the mean, median and mode of the existing values in that column and then prints the results for observation.
- df['Marks'].fillna(df['Marks'].mean()): Fills missing values in the 'Marks' column with the mean value.
- df['Marks'].fillna(df['Marks'].median()): Fills missing values in the 'Marks' column with the median value.
- df['Marks'].fillna(df['Marks'].mode(): Fills missing values in the 'Marks' column with the mode value.
- .iloc[0]: Accesses the first element of the Series which represents the mode.
Pros: easy, fast, suitable for numeric variables
Cons: may distort the true distribution of the data
2. Forward and Backward Fill : These methods fill missing values using the closest available values in the column. They are useful for ordered or time-series data.
Python
forward_fill = df['Marks'].fillna(method='ffill')
backward_fill = df['Marks'].fillna(method='bfill')
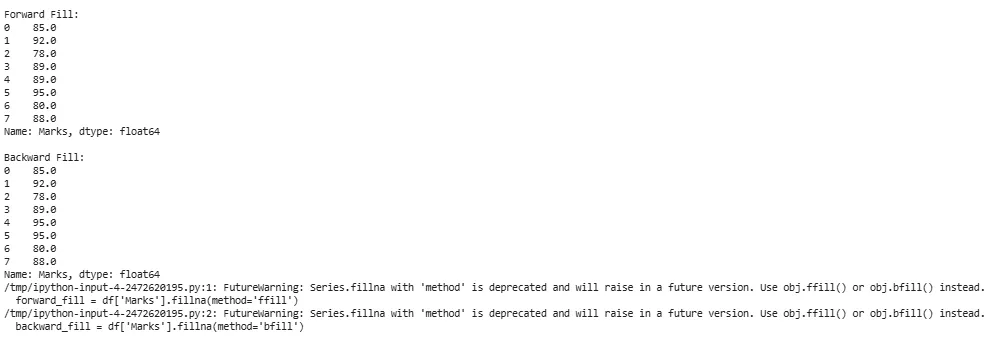
print("\nForward Fill:")
print(forward_fill)
print("\nBackward Fill:")
print(backward_fill)
Output:
 Forward and Backward Fill
Explanation:The method parameter in fillna() allows to specify the filling strategy.
- df['Marks'].fillna(method='ffill'): This method fills missing values in the 'Marks' column of the DataFrame (df) using a forward fill strategy. It replaces missing values with the last observed non-missing value in the column.
- df['Marks'].fillna(method='bfill'): This method fills missing values in the 'Marks' column using a backward fill strategy. It replaces missing values with the next observed non-missing value in the column.
Pros: preserves order and patterns in data
Cons: may be inaccurate when gaps are large or values differ significantly
Note:
- Forward fill uses the last valid observation to fill missing values.
- Backward fill uses the next valid observation to fill missing values.
3. Interpolation Techniques
Interpolation estimates missing values by using the trend or pattern of surrounding data points. It is more informative than simple imputation.
Python
linear_interpolation = df['Marks'].interpolate(method='linear')
quadratic_interpolation = df['Marks'].interpolate(method='quadratic')
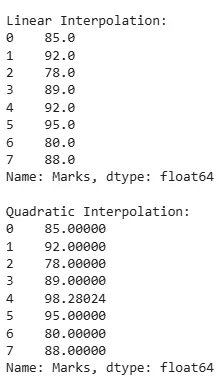
print("\nLinear Interpolation:")
print(linear_interpolation)
print("\nQuadratic Interpolation:")
print(quadratic_interpolation)
Output:
 Interpolation techniques
Explanation: The interpolate() method in pandas are divided into Linear and Quadratic.
- df['Marks'].interpolate(method='linear'): This method performs linear interpolation on the 'Marks' column of the DataFrame (df).
- df['Marks'].interpolate(method='quadratic'): This method performs quadratic interpolation on the 'Marks' column.
Pros: captures trends, preserves relationships
Cons: assumes a pattern (linear, quadratic), may be complex
Note:
- Linear interpolation assumes a straight line between two adjacent non-missing values.
- Quadratic interpolation assumes a quadratic curve that passes through three adjacent non-missing values.
Impact of Handling Missing Values
Handling missing values effectively is important to ensure the accuracy and reliability of our findings.
- Improved data quality: A cleaner dataset with fewer missing values is more reliable for analysis and model training.
- Enhanced model performance: Properly handling missing values helps models perform better by training on complete data, leading to more accurate predictions.
- Preservation of Data Integrity: Imputing or removing missing values ensures consistency and accuracy in the dataset, maintaining its integrity for further analysis.
- Reduced bias: Addressing missing values prevents bias in analysis, ensuring a more accurate representation of the underlying patterns in the data.
Explore
Machine Learning Basics
Python for Machine Learning
Feature Engineering
Supervised Learning
Unsupervised Learning
Model Evaluation and Tuning
Advanced Techniques
Machine Learning Practice