Statistics For Machine Learning
Last Updated :
11 Sep, 2025
Statistics for Machine Learning is the study of collecting, analyzing and interpreting data to help build better machine learning models. It provides the mathematical foundation to understand data patterns, make predictions and evaluate model performance.
- It helps in understanding data distribution, variability and selecting the most useful features.
- It is used to validate model results and make decisions under uncertainty using hypothesis tests, confidence intervals and Bayesian methods.
 Machine Learning Statistics
Why Learn Statistics for Machine Learning
- Understand the data before training models.
- Choose the right algorithms for specific problems.
- Evaluate model accuracy and performance.
- Handle uncertainty and variability in real-world data.
Applications of Statistics in Machine Learning
Statistics is a key component of machine learning, with broad applicability in various fields.
- Feature Engineering: selecting and transforming useful variables.
- Image Processing: analyzing patterns, shapes and textures.
- Anomaly Detection: spotting fraud or equipment failures.
- Environmental Studies: modeling land cover, climate and pollution.
- Quality Control: identifying defects in manufacturing.
Types of Statistics
There are commonly two types of statistics, which are discussed below:
- Descriptive Statistics: "Descriptive Statistics" helps us simplify and organize big chunks of data. This makes large amounts of data easier to understand.
- Inferential Statistics: "Inferential Statistics" is a little different. It uses smaller data to draw conclusions about a larger group. It helps us predict and draw conclusions about a population.
Descriptive Statistics
Descriptive statistics summarize and describe the features of a dataset, providing a foundation for further statistical analysis.
Mean | Median | Mode |
|---|
Mean is the sum of all values divided by the total number of values.
Mean μ = Sum of Values \ Number of Values
| Median is the middle value of sorted data For odd number of data points: Median = (\frac{n+1}{2})^{th} For even number of data points: Median = Average of (\frac{n}{2})^{th} value and its next value | Mode is the most frequently occurring value in the dataset.
|
Measures of Dispersion
- Range: The difference between the maximum and minimum values.
- Variance: The average squared deviation from the mean, representing data spread.
- Standard Deviation: The square root of variance, indicating data spread relative to the mean.
- Interquartile Range: The range between the first and third quartiles, measuring data spread around the median.
Measures of Shape
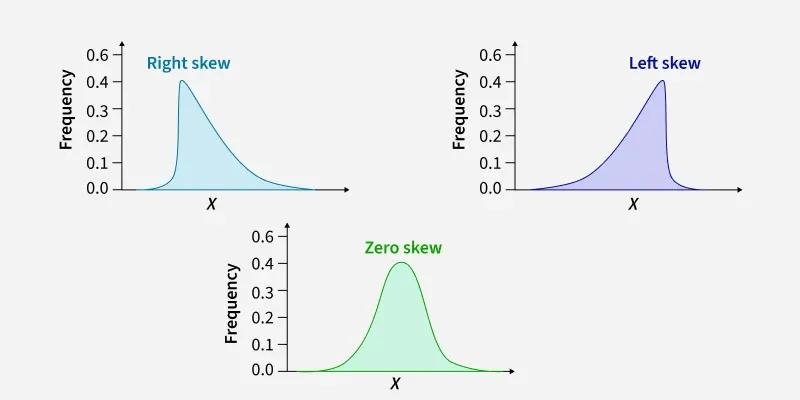 Skewness
- Kurtosis: Measures the peakedness of the data distribution.
 Types of Skewed data
Inferential Statistics
Inferential statistics involve making predictions or inferences about a population based on a sample of data.
Population and Sample
- Population: The entire group being studied.
- Sample: A subset of the population used for analysis.
Estimation
Hypothesis Testing
Hypothesis testing is a method that compares two opposite assumptions about a population and uses data from a sample to determine which assumption is more likely to be true.
Covariance and Correlation
Covariance | Correlation |
|---|
Covariance measures the degree to which two variables change together.
Cov(x,y) = \frac{\sum(X_i-\overline{X})(Y_i - \overline{Y})}{n} | Correlation shows how strongly and in which direction two variables are related. Its coefficient ranges from -1 to 1, where positive means they move together and negative means they move oppositely.
Pearson's correlation coefficient is given by:
\rho(X, Y) = \frac{cov(X,Y)}{\sigma_X \sigma_Y} |
Visualization Techniques
Regression Analysis
Understanding relationships between variables is important in machine learning.
Probability Theory
Probability theory forms the backbone of statistical inference, aiding in quantifying uncertainty and making predictions based on data.
Basic Concepts
Common Probability Distributions
Bayesian Statistics
Bayesian statistics combine prior knowledge (what we already believe) with new data (current evidence) to update our understanding.
Bayes' Theorem is a fundamental concept in probability theory that relates conditional probabilities. It is named after the Reverend Thomas Bayes, who first introduced the theorem. Bayes' Theorem is a mathematical formula that provides a way to update probabilities based on new evidence.
Formula:
P(A \mid B) = \frac{P(B \mid A) \times P(A)}{P(B)}
Where
- P(A∣B): The probability of event A given that event B has occurred (posterior probability).
- P(B∣A): The probability of event B given that event A has occurred (likelihood).
- P(A): The probability of event A occurring (prior probability).
- P(B): The probability of event B occurring.
Related Articles
Explore
Machine Learning Basics
Python for Machine Learning
Feature Engineering
Supervised Learning
Unsupervised Learning
Model Evaluation and Tuning
Advanced Techniques
Machine Learning Practice