Rotating X-axis Labels in Bokeh Figure
Last Updated :
23 Aug, 2024
Bokeh is a powerful visualization library in Python that allows users to create interactive plots and dashboards. One common requirement when creating plots is to adjust the orientation of axis labels to improve readability, especially when dealing with long labels or limited space. This article focuses on how to rotate X-axis labels in a Bokeh figure, providing a detailed guide with examples.
Understanding Bokeh's Axis Label Orientation
Bokeh provides a flexible way to customize plots, including the orientation of axis labels. The major_label_orientation property is used to control the angle of the labels on an axis. By default, labels are horizontal, but you can rotate them to any angle that suits your needs.
Why Rotate X-Axis Labels?
Rotating X-axis labels can be beneficial in several scenarios:
- Long Labels: When the labels are too long to fit horizontally without overlapping.
- Limited Space: In plots with limited horizontal space, rotating labels can prevent clutter.
- Improved Readability: Angled labels can sometimes be easier to read, depending on the layout.
Bokeh Plot with X-Axis Label Rotation
Let's create a simple Bokeh plot and demonstrate how to rotate the X-axis labels.
Step 1: Import Necessary Libraries
Python
from bokeh.plotting import figure, show, output_notebook
from bokeh.io import output_file
Step 2: Prepare the Data
Python
# Sample data
categories = ['Category A', 'Category B', 'Category C', 'Category D']
values = [10, 20, 15, 25]
# Create a new plot with a title and axis labels
p = figure(x_range=categories, plot_height=350, title="Category Values",
           toolbar_location=None, tools="")
Step 4: Add Glyphs
Python
# Add a bar renderer
p.vbar(x=categories, top=values, width=0.9)
Step 5: Rotate X-Axis Labels
To rotate the X-axis labels, set the major_label_orientation property. For example, to rotate the labels by 45 degrees:
Python
# Rotate x-axis labels by 45 degrees
p.xaxis.major_label_orientation = 0.785  # 45 degrees in radians
Alternatively, to rotate by 90 degrees:
Python
# Rotate x-axis labels by 90 degrees
p.xaxis.major_label_orientation = 1.5708  # 90 degrees in radians
# Output to a static HTML file
output_file("bar_chart.html")

# Show the plot
show(p)
Output:
 Rotating X-Axis Labels
Additionally, you can refer to the link : Chart
Example 1: Customizing Font and Orientation
In this example, we customize the font size and style along with rotating the X-axis labels.
- Font Customization: The font size is set to "12pt" and the style to "italic" to enhance the appearance of the labels.
- Rotation: The labels are rotated by 90 degrees, making them vertical.
Python
from bokeh.plotting import figure, show, output_file

# Sample data
categories = ['Category 1', 'Category 2', 'Category 3']
values = [30, 40, 50]

# Create a new plot with a title and axis labels
p = figure(x_range=categories, height=350, title="Customized Category Values", toolbar_location=None, tools="")

# Add a bar renderer
p.vbar(x=categories, top=values, width=0.9)

# Rotate x-axis labels by 90 degrees
p.xaxis.major_label_orientation = 1.5708  # 90 degrees in radians

# Customize font size and style
p.xaxis.major_label_text_font_size = "12pt"
p.xaxis.major_label_text_font_style = "italic"

# Output to a static HTML file
output_file("customized_bar_chart.html")

# Show the plot
show(p)
Output:
 Rotating X-axis Labels in Bokeh Figure
Additionally, you can refer to the link : Chart
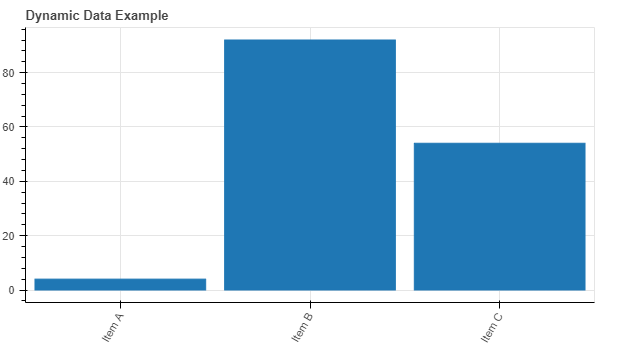
Example 2: Handling Dynamic Data with Rotated Labels
This example shows how to handle dynamic data, ensuring that label rotation is applied correctly after data updates.
- Dynamic Data: The ColumnDataSource is used to manage data, allowing updates without recreating the plot.
- Rotation: The labels are rotated by 60 degrees to accommodate changes in data dynamically.
Python
from bokeh.plotting import figure, show, output_file
from bokeh.models import ColumnDataSource
from bokeh.io import curdoc
from random import randint

# Sample data
categories = ['Item A', 'Item B', 'Item C']
values = [randint(1, 100) for _ in categories]

# Create a ColumnDataSource
source = ColumnDataSource(data=dict(categories=categories, values=values))

# Create a new plot with a title and axis labels
p = figure(x_range=categories, height=350, title="Dynamic Data Example", toolbar_location=None, tools="")

# Add a bar renderer
p.vbar(x='categories', top='values', width=0.9, source=source)

# Rotate x-axis labels by 60 degrees
p.xaxis.major_label_orientation = 1.0472  # 60 degrees in radians

# Output to a static HTML file
output_file("dynamic_data_chart.html")

# Show the plot
show(p)

# Update function to simulate dynamic data
def update():
    new_values = [randint(1, 100) for _ in categories]
    source.data = dict(categories=categories, values=new_values)

# Add periodic callback to update data
curdoc().add_periodic_callback(update, 2000)
Output:
 Rotating X-axis Labels in Bokeh Figure
Additionally, you can refer to the link : Chart
Common Issues and Solutions
- Overlapping Labels: If labels overlap even after rotation, consider increasing the plot width or reducing the font size.
- Non-Uniform Label Lengths: For labels of varying lengths, rotating them can help maintain a clean look.
- Dynamic Plots: For plots that change dynamically, ensure the rotation setting is applied after any updates to the plot.
Conclusion
Rotating X-axis labels in Bokeh is a straightforward process that can significantly enhance the readability of your plots. By using the major_label_orientation property, you can adjust the angle of the labels to suit your specific needs. Bokeh's flexibility allows for extensive customization, making it a valuable tool for creating interactive and visually appealing data visualizations.