How to Calculate Standard Error in Excel: Easy Steps, Formula, and Tips for Accurate Data Analysis
Last Updated :
01 Oct, 2024
How to Calculate Standard Error in Excel - Quick Steps
- Enter your data
- Create labels
- Calculate your standard deviation
- Count your items
- Calculate standard error
Standard error is essential for assessing how closely a sample's mean matches the overall population mean. In this article you will learn how to calculate standard error in Excel using both formulas and step-by-step instructions.
 Calculate Standard Error in Excel
What is Standard Error
Standard error calculation provides valuable insight into the likely deviation of the mean value of a sample dataset from the overall mean value of the larger data population under evaluation. For instance, consider a scenario where a company aims to gauge customer satisfaction ratings within its customer base. By collecting ratings from a representative subset of their client, the standard error calculation aids the company in assessing the extent to which the sampled information aligns with the broader sentiment of all customers.
Why is the Standard Error Calculation Important
The Standard error emerges as a crucial calculation, particularly when working with sample data sets, as it furnishes a reliable estimation of their credibility. As the number of samples integrated into your standard deviation calculation expands, the magnitude of your standard error diminishes. This reduction signals in increased level of confidence in the accuracy of the sample, establishing a stronger connection between the sample's insights and the broader population.
How to Calculate Standard Error in Excel
Follow these steps to create a formula in Excel that calculates the standard error for a data set:
Formula:
Standard Error=Standard Deviation/sqrt(n)
Where
Let's follow the below steps and take a look at an example:
Step 1: Enter your Dataset
The dataset is given as follows:

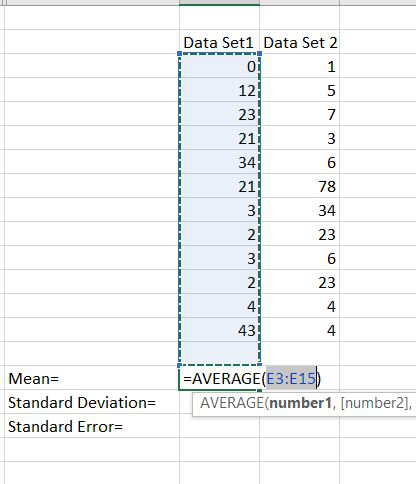
Step 2: Calculate Mean
Now for calculating the standard error we have to find the mean, standard deviation.
Step 3: Enter the Data Range in which you want to calculate your Standard deviation
Here we are calculating the standard deviation. And we have selected the rows whose standard deviation we have to calculate.

Step 4: Calculate Standard Error
Now for calculating the standard error we have divided the standard deviation with the square root of no. of samples. The no. of samples here are 12.

This is the way by which we have calculated the standard error. In this mean was optional.
Tips for Calculating Standard Error in Excel
When harnessing the Power of Microsoft Excel for standard error calculations, consider below tips to streamline your process and optimize your results:
Simplify with Comprehensive Formulas
While maintaining clarity is paramount, you can opt for a more streamlined approach by consolidating your calculations. Although individual computations for standard deviation and count provide transparency, they are not obligatory. You can choose to employ a single formula that encompasses both calculations. To achieve this, substitute each cell in the standard error formulas with the formula used in those cells. "STDEV(A2:A6)/SQRT(COUNT(A2:A6))".
Plan your Document
Before delving into the creation of your spreadsheet layout, take a moment to chart out your document's blueprint. This preliminary planning ensures a more efficient design, tailored to your specific needs. Grasping the mature of your data, the number of entries, and whether your datasets is static or prone to future expansion will guide the strategic placement of labels and calculations, leading to a well-structured document.
Expand your Ranges
Incorporate foresight into your standard deviation and count formulas by extending your data ranges beyond your final data point. Excel's calculations functions adeptly ignore blank cells, affording you the ability to future-proof your calculations. This approach enables you to add new data points seamlessly in the future without necessity of adjusting your formulas.
Conclusion
Mastering standard error calculations in Excel will elevate your statistical analysis capabilities. By understanding the formula and using Excel's powerful functions, you can ensure your sample data more accurately reflects the broader population.
Similar Reads
How to Calculate Average in Excel: Essential Formulas & Examples for 2024
Whether you're a student crunching numbers for a project, a business analyst examining sales data, or simply someone looking to get insights from personal data, mastering the art of calculating averages in Excel can significantly enhance your data-handling capabilities.In this article, you will lear
8 min read
How to Calculate Time in Excel: Step by Step Guide with Formulas
Working with time in Excel can make tasks like tracking hours, calculating time differences, or managing schedules much easier. Excel provides simple tools to calculate time, figure out time differences, and even add or subtract hours using formulas. In this guide, you’ll learn about time formatting
9 min read
Standard Deviation - Formula, Examples & How to Calculate
Standard deviation is a statistical measure that describes how much variation or dispersion there is in a set of data points. It helps us understand how spread out the values in a dataset are compared to the mean (average). A higher standard deviation means the data points are more spread out, while
15+ min read
How to Add a Calculated Field to a Pivot Table in Excel
A Calculated Field in Pivot Table allows you to perform custom calculations within your Excel Pivot Table, giving you more flexibility and deeper insights into your data. Whether you need to add a custom formula, modify existing calculations, or remove a field, this guide walks you through the essen
6 min read
How to Calculate Mean Absolute Error in Excel?
Mean absolute error is the measure of error between the observed and the expected values in a given data set. Where, O stands for Observed values,E stands for Expected values,n stands for total no. of observations. Now let us understand it with the help of an example. Example: Follow the below steps
1 min read
How to calculate standard error and CI to plot in R
In statistics, the standard error (SE) and confidence intervals (CI) are essential measures used to understand the variability and uncertainty associated with a sample statistic, such as the mean. In R Programming Language Calculating these values is crucial for assessing the reliability of estimate
9 min read
How to Calculate Mean Absolute Percentage Error in Excel?
In statistics, we often use Forecasting Accuracy which denotes the closeness of a quantity to the actual value of that particular quantity. The actual value is also known as the true value. It basically denotes the degree of closeness or a verification process that is highly used by business profess
2 min read
How to calculate Sum and Average of numbers using formulas in MS Excel?
Everyday in school, offices, business sectors or any other field lots of information are there that are required to store for future use. For anyone, it is very difficult to remember that information for a long time. Earlier data and information are stored in a form of a register, file, or by paperw
4 min read
How to Calculate a Bootstrap Standard Error in R?
In this article, we will be looking at the different approaches to calculate a bootstrap standard error using various packages and their functionalities in the R programming language. Bootstrap Standard Error: The standard deviation of the bootstrap samples (also known as the bootstrap standard erro
3 min read
How to Create a Line Chart for Comparing Data in Excel?
Excel is powerful data visualization and data management tool which can be used to store, analyze, and create reports on large data. It can be used to visualize data using a graph plot. In excel, we can plot different kinds of graphs like line graphs, bar graphs, etc., to visualize or analyze the tr
2 min read