Types of Frequency Distribution
Last Updated :
28 Jul, 2024
Frequency distribution is a method of organizing and summarizing data to show the frequency (count) of each possible outcome of a dataset. It is an essential tool in statistics for understanding the distribution and pattern of data. There are several types of frequency distributions used based on the nature of the data and the analysis required.
It is not always possible for an investigator to easily measure the items of a series or set of data. To make the data simple and easy to read and analyze, the items of the series are placed within a range of values or limits. In other words, the given raw set of data is categorized into different classes with a range, known as Class Intervals. Every item of the given series is put against a class interval with the help of tally bars. The number of items occurring in the specific range or class interval is shown under Frequency against that particular class range to which the item belongs.
Frequency Distribution Examples
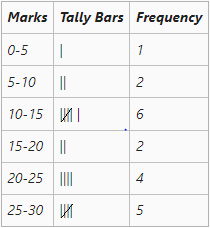
The marks of a class of 20 students are 11, 27, 18, 14, 28, 18, 2, 22, 11, 24, 22, 11, 8, 20, 25, 28, 30, 12, 11, 8. Prepare a frequency distribution table for the same.
Solution:
The range of marks of the students is 2- 28. Let us take class intervals 0-5, 5-10, 10-15, 15-20, 20-25, and 25-30.
Types of Frequency Distribution
The six different types of the frequency distribution are as follows:
- Exclusive Series
- Inclusive Series
- Open End Series
- Cumulative Frequency Series
- Mid-Value Frequency Series
- Equal and Unequal Class Interval Series
1. Exclusive Series
The series with class intervals, in which all the items having the range from the lower limit to the value just below its upper limit are included, is known as the Exclusive Series. This kind of frequency distribution is known as an exclusive series because the frequencies corresponding to the specific class interval do not include the value of its upper limit. For example, if a class interval is 0-10, and the values of the given series are 4, 10, 2, 15, 8, and 9, then only 4, 2, 8, and 9 will be included in the 0-10 class interval. 10 and 15 will be included in the next class interval, i.e., 10-20. Also, the upper limit of a class interval is the lower limit of the next class interval.
Frequency Distribution in Exclusive Series Example

From the above table of exclusive series, it can be seen that the upper limits of the first class interval is the lower limit of the second class interval, and so on. Also, as discussed above, if the data includes a value 10, it will be included in the class interval 10-20, not in 0-10.
2. Inclusive Series
The series with class intervals, in which all the items having the range from the lower limit up to the upper limit are included, is known as Inclusive Series. Like exclusive series, the upper limit of one class interval does not repeat itself as the lower limit of the next class interval. Therefore, there is a gap (between 0.1 to 1) between the upper-class limit of one class interval and the lower limit of the next class interval. For example, class intervals of an inclusive series can be, 0-9, 10-19, 20-29, 30-39, and so on. In this case, the gap between the upper limit of one class interval and the lower limit of the next class interval is 1, and the class intervals do not overlap with each other like in an exclusive series.
Sometimes it gets difficult to perform statistical analysis with inclusive series. In those cases, the inclusive series is converted into an exclusive series.
Frequency Distribution in Inclusive Series Example

From the above table of inclusive series, it can be seen that the upper limit of one class interval (say, 9 of interval 0-9) is not the same as the lower limit of the next class interval (10 of interval 10-19). Also, all the values that come under 0-9, including 0 and 9 are included in the frequency against 0-9.
Conversion of Inclusive Series into Exclusive Series
For statistical calculation, sometimes it becomes necessary to convert the inclusive series into exclusive series. Suppose, in the above example some students have obtained marks such as 10.5, 40,5, etc. In this case, this series will be converted into exclusive series,
The steps for converting an inclusive series into exclusive series are:
- In this first step, calculate the difference between the upper class limit of one class interval and the lower limit of the next class interval.
- The next step is to divide the difference by two and then add the resulting value to the upper limit of every class interval and subtract it from the lower limit of every class interval.
Example:
The inclusive series of the above example is converted into exclusive series as under.

Difference between Inclusive and Exclusive Series
- In Inclusive Series, the upper limit of one class interval is not the same as the lower limit of the next class interval. There is a gap ranging from 0.1 to 1.0 between the upper class limit of one class interval and the lower class limit of the next class interval. However, in the Exclusive Series, the upper limit of one class interval is the same as the lower limit of the next class interval.
- In the case of Inclusive Series, the value of the upper and the lower limit are included in that class interval only. However, in the case of Exclusive Series, the value of upper limit of a class interval is not included in that interval, instead, it is included in the next class interval.
- Inclusive Series is suitable for an investigator only if the value is in complete number and not in decimal form. However, an Exclusive Series is suitable for an investigator whether the value is in complete number or decimal form.
- Counting in Inclusive Series is possible only after converting it into an Exclusive Series. However, counting in Exclusive Series is possible in all cases.
3. Open End Series
Sometimes the lower limit of the first class interval and the upper class limit of a series is not available; instead, Less than or Below is mentioned in the former case (in place of the lower limit of the first class interval), and More than or Above is mentioned in the latter case (in place of the upper limit of the last class interval). These types of series are known as Open End Series.
Frequency Distribution in Open End Series Example

For statistical calculations, if one needs to change the first and last class open-end class interval into limits, it can be done by the general practice of giving the same magnitude or class size to these intervals as the class size of other class intervals. In the above example, the magnitude of other class intervals is 5. Therefore, the open-end class intervals can be written as 5-10 and 30-35, respectively.
4. Cumulative Frequency Series
A series whose frequencies are continuously added corresponding to the class intervals is known as Cumulative Frequency Series.
Conversion of a Simple Frequency Series into Cumulative Frequency Series
A simple frequency series can be converted into a cumulative frequency series. There are two ways through which it can be done. These are as follows:
- Expressing the cumulative frequencies on the basis of the upper limits of the class intervals. For example, expressing 10-20, 20-30, and 30-40 as Less than 20, Less than 30, and Less than 40.
- Expressing the cumulative frequencies on the basis of lower limits of the class intervals. For example, expressing 10-20, 20-30, and 30-40 as More than 20, More than 30, and More than 40.
Frequency Distribution in Cumulative Frequency Series Example
Convert the following simple frequency series into a cumulative frequency series using both ways.

Solution:
Method-I (On the Basis of Upper Limits)

Method - II (On the Basis of Lower Limits)

Conversion of Cumulative Frequency into Simple Frequency Series
To attain the frequency against a specific class interval of a cumulative frequency series, it can be converted into a simple frequency series.
Example:
Determine the frequency of the following cumulative frequency series.

Solution:

5. Mid-Value Frequency Series
The series in which, instead of class intervals, their mid-values are given with the corresponding frequencies, is known as Mid-Value Frequency Series.
Conversion of Mid-Value Frequency Series into Simple Frequency Series
The steps to convert a mid-value frequency series into a simple frequency series are as follows:
- The first step is to determine the mutual difference between the mid-values.
- The next step is to obtain half of the resulting difference.
- The last step of conversion is to subtract the resulting figure from the second step from the mid-value to get the lower limit of the class interval, and add the resulting figure from the second step to the mid-value to get the upper limit.
Lower~Limit~({l_1})=m-\frac{1}{2}i
Upper~Limit~({l_2})=m+\frac{1}{2}i
m = Mid-Value
i = Difference between mid-values
l_1=lower~limit
l_2=upper~limit
Frequency Distribution in Mid-Value Frequency Series Example
Convert the following Mid-Value Frequency Series into Simple Frequency Series.

Solution:

Calculation:
Difference between mid-values (i) = 10

6. Equal and Unequal Class Interval Series
Equal Class Interval Series
When the classes of a series are of the same interval, it is known as Equal Class Interval Series.
Example of Frequency Distribution in Equal Class Interval Series
Following is the frequency distribution of marks of 25 students with equal class intervals.

Unequal Class Interval Series
When the classes of a series are of unequal interval, it is known as Equal Class Interval Series.
Example of Frequency Distribution in Unequal Class Interval Series:
Following is the frequency distribution of marks of 30 students with unequal class intervals.

Summary - Types of Frequency Distribution
Frequency distribution is a crucial tool in statistics used to organize and summarize data. The main types include ungrouped, grouped, cumulative, and relative frequency distributions. Ungrouped frequency distribution lists each individual data point and its frequency, while grouped frequency distribution categorizes data into intervals. Cumulative frequency distribution provides a running total of frequencies, and relative frequency distribution shows the proportion of total observations in each category. These methods help in understanding the distribution and pattern of data, facilitating better analysis and decision-making.
Practice Questions on Types of Frequency Distribution
1. Given the dataset: 5, 7, 8, 5, 6, 7, 8, 9, 5, 6, 7, 8, 9, 10, 5. Create an ungrouped frequency distribution.
2. Consider the dataset: 12, 15, 17, 19, 22, 25, 27, 29, 30, 32, 35, 37, 39, 40. Construct a grouped frequency distribution with class intervals of 10 units.
3. Using the grouped frequency distribution from Question 2, create a cumulative frequency distribution.
4. Given the grouped frequency distribution in Question 2, calculate the relative frequency distribution.
Similar Reads
CBSE Class 11 Statistics for Economics Notes
Economic statistics is a topic in applied statistics that concerns the collection, organization, and presentation of data. GeeksforGeeks Class 11 Statistics for Economics Notes have been designed according to the CBSE Syllabus for Class 11. These revision notes consist of detailed Chapterwise import
8 min read
Chapter 1: Concept of Economics and Significance of Statistics in Economics
Chapter 2: Collection of Data
Data Collection Methods | Primary and Secondary Data
Data Collection refers to the systematic process of gathering, measuring, and analyzing information from various sources to get a complete and accurate picture of an area of interest. Data collection is a critical step in any research or data-driven decision-making process, ensuring the accuracy and
11 min read
Sources of Data Collection | Primary and Secondary Sources
Data Collection refers to the systematic process of gathering, measuring, and analyzing information from various sources to get a complete and accurate picture of an area of interest. Different sources of data collection include Primary Sources and Secondary Sources. What is Data?Data is a collectio
8 min read
Direct Personal Investigation: Meaning, Suitability, Merits, Demerits and Precautions
What is Direct Personal Investigation?Direct Personal Investigation or Personal Interview is a method of collecting primary data through which the investigator contacts the informant directly to collect data by conducting on-the-spot enquiry. He/she goes to the field personally, contacts the respond
4 min read
Indirect Oral Investigation : Suitability, Merits, Demerits and Precautions
What is Indirect Oral Investigation?Indirect Oral Investigation is a method of collecting primary data through which the investigator approaches third parties who are in the possession of required information about the subject of enquiry. It is used when the area of investigation is large or the res
4 min read
Difference between Direct Personal Investigation and Indirect Oral Investigation
Direct Personal Investigation and Indirect Oral Investigation are two of the many methods of collecting primary data. What is Direct Personal Investigation? Direct Personal Investigation or Personal Interview is a method of collecting primary data through which the investigator contacts the informan
3 min read
Information from Local Source or Correspondents: Meaning, Suitability, Merits, and Demerits
Data is the collection of measurements and facts and a tool that helps an individual or a group of individuals reach a sound conclusion by providing them with some information. It helps the analyst understand, analyze, and interpret different socio-economic problems like unemployment, poverty, infla
3 min read
Questionnaires and Schedules Method of Data Collection
Questionnaires & Schedule method of data collection :The questionnaires are the fundamental instrument for gathering information in review research. Fundamentally, it is a bunch of standardized questions, frequently called items, which follow a decent plan to gather individual information around
5 min read
Difference between Questionnaire and Schedule
Questionnaires and Schedules are two methods of collecting primary data and are different from each other in many ways. What is a Questionnaire? A questionnaire is a research instrument used by any researcher as a tool to collect data or gather information from any source or subject of his or her in
3 min read
Qualities of a Good Questionnaire and Types of Questionnaires
Meaning of QuestionnaireA questionnaire is a research instrument used by any researcher as a tool to collect data or gather information from any source or subject of his or her interest from the respondents. It has a specific goal to understand topics from the respondent's point of view. It consists
5 min read
What are the Published Sources of Collecting Secondary Data?
What is Data?Data is the collection of measurements and facts and a tool that helps an individual or a group of individuals reach a sound conclusion by providing them with some information. It helps the analyst understand, analyse, and interpret different socio-economic problems like unemployment, p
3 min read
What Precautions should be taken before using Secondary Data?
In the plural sense, Statistics refers to facts or quantitative information that can be used to draw significant conclusions. Hence, for a student of Economics, the main purpose to collect data is to recognize, evaluate, and describe a social issue. For example, the problem of poverty or the problem
3 min read
Two Important Sources of Secondary Data: Census of India and Reports & Publications of NSSO
Data is the collection of measurement and facts and a tool that help an individual or a group of individuals reach a sound conclusion by providing them with some information. It helps the analyst understand, analyze, and interpret different socio-economic problems like unemployment, poverty, inflati
3 min read
What is National Sample Survey Organisation (NSSO)?
National Sample Survey (NSS) was set up on the recommendations of the National Income Committee in 1950 and was chaired by the late Professor P.C. Mahalanobis. The basic aim behind setting up NSS was to fill up the large gaps in statistical data to calculate the national income aggregates (especiall
3 min read
What is Census Method of Collecting Data?
Collection of Data is the first step of the statistical investigation and can be gathered through two different sources, namely, primary sources and secondary sources. Besides primary and secondary sources of collecting data, there are two essential methods of collecting data; i.e., Census Method an
4 min read
Sample Method of Collection of Data
Meaning of Population:A population is a pool of similar objects, items, or events that are used to define the subject of study, which is related to some questions or events under study. In statistics, it means the aggregate of all items about which we want to collect information. The population can
6 min read
Methods of Sampling
The sampling method involves selecting a subset of individuals or observations from a larger population to collect data and make inferences about the entire population. It is a practical and efficient way to gather data when it is impractical or impossible to collect information from every member of
11 min read
Father of Indian Census
Who is the Father of Indian Census? Census, a systematic collection and recording of demographic, social, and economic data of a country's population, stands as one of the most crucial tools for understanding the dynamics of a society. In the context of India, the census has played an indispensable
5 min read
What makes a Sampling Data Reliable?
Data is the collection of measurement and facts and a tool that help an individual or a group of individuals reach a sound conclusion by providing them with some information. It helps the analyst understand, analyze, and interpret different socio-economic problems like unemployment, poverty, inflati
2 min read
Difference between Census Method and Sampling Method of Collecting Data
Collection of Data is the first step of the statistical investigation and can be gathered through two different sources, namely, primary sources and secondary sources. Besides primary and secondary sources of collecting data, there are two essential methods of collecting data; i.e., Census Method an
4 min read
What are Statistical Errors?
Data is the collection of measurement and facts and a tool that help an individual or a group of individuals reach a sound conclusion by providing them with some information. It helps the analyst understand, analyze, and interpret different socio-economic problems like unemployment, poverty, inflati
3 min read
Chapter 3: Organisation of Data
Organization of Data
What is Data Organization? The data collected by an investigator is in raw form and cannot offer any meaningful conclusion; hence, it needs to be organized properly. Therefore, the process of systematically arranging the collected data or raw data so that it can be easy to understand the data is kno
6 min read
Objectives and Characteristics of Classification of Data
Data can not always be found in an organised manner. Therefore, an analyst or investigator has to properly organise the collected data for a better analysis of information and to reach the desired results. One of the most important methods of organising such data is known as the classification of da
5 min read
Classification of Data in Statistics | Meaning and Basis of Classification of Data
Classification of data refers to the systematic organization of raw data into groups or categories based on shared characteristics or attributes. This process transforms unstructured data into a structured format, making it easier to analyze and draw meaningful conclusions. Data can be classified ba
5 min read
Concept of Variable and Raw Data
The data collected by an investigator is in raw form and cannot offer any meaningful conclusion; hence, it needs to be organized properly. Therefore, the process of systematically arranging the collected data or raw data so that it can be easy to understand is known as the organization of data. With
4 min read
Types of Statistical Series
In statistics, data is often organized in series to facilitate analysis and interpretation. A statistical series refers to a set of observations arranged in a particular order based on one or more criteria. Understanding the different types of statistical series is crucial for effectively analyzing
12 min read
Difference between Frequency Array and Frequency Distribution
The number of times a specific value appears in a distribution is known as its frequency. For instance, there are 30 students in a class, and fifteen of them have received 80 points, ten have received 90 points, and five have received 100 points. The frequencies will now be 15, 10, and 5. A table in
4 min read
Types of Frequency Distribution
Frequency distribution is a method of organizing and summarizing data to show the frequency (count) of each possible outcome of a dataset. It is an essential tool in statistics for understanding the distribution and pattern of data. There are several types of frequency distributions used based on th
10 min read
Chapter 4: Presentation of Data: Textual and Tabular
Textual Presentation of Data: Meaning, Suitability, and Drawbacks
Presentation of Data refers to the exhibition of data in such a clear and attractive way that it is easily understood and analysed. Data can be presented in different forms, including Textual or Descriptive Presentation, Tabular Presentation, and Diagrammatic Presentation. Textual Presentation Textu
3 min read
Tabular Presentation of Data: Meaning, Objectives, Features and Merits
What is Tabulation?The systematic presentation of numerical data in rows and columns is known as Tabulation. It is designed to make presentation simpler and analysis easier. This type of presentation facilitates comparison by putting relevant information close to one another, and it helps in further
8 min read
Different Types of Tables
The tables can be categorised into various categories depending upon different aspects, such as the purpose, the nature of data used for the investigation, and the extent of coverage of the table. The following are the various kinds of tables that are commonly used in studies of statistics. (I) Clas
4 min read
Classification and Tabulation of Data
Classification and Tabulation of Data are fundamental processes in the field of statistics, especially in the context of economics. They transform raw data into a structured form, enabling better analysis, interpretation, and presentation of economic data. Proper classification ensures that data is
11 min read
Chapter 5: Diagrammatic Presentation of Data
Diagrammatic Presentation of Data: Meaning , Features, Guidelines, Advantages and Disadvantages
Diagrammatic Presentation of Data The technique of presenting statistical data in the form of diagrams such as bar diagrams, cartograms, pie diagrams, and pictograms is known as the Diagrammatic Presentation of Data. Statistics performs an important function by presenting a complex mass of data in a
6 min read
Types of Diagrams
What is a Diagram?Statistics performs an important function by presenting a complex mass of data in a simple way that makes it easier to understand. Classification and tabulation are two techniques for presenting data in an understandable form. However, as the volume of data increases, it becomes in
7 min read
Bar Graph | Meaning, Types, and Examples
Bar graphs are one of the most common and versatile types of charts used to represent categorical data visually. They display data using rectangular bars, where the length or height of each bar corresponds to the value it represents. Bar graphs are widely used in various fields such as business, edu
12 min read
Pie Diagrams | Meaning, Example and Steps to Construct
What is Pie Chart or Pie Diagram?A circle can be divided into parts to show the ratios of different components. A pie diagram is one such representation. Pie charts are also referred to as Angular Circle Diagrams. The circle is divided into as many sections as there are elements by drawing straight
2 min read
Histogram | Meaning, Example, Types and Steps to Draw
What is Histogram?A histogram is a graphical representation of the frequency distribution of continuous series using rectangles. The x-axis of the graph represents the class interval, and the y-axis shows the various frequencies corresponding to different class intervals. A histogram is a two-dimens
5 min read
Frequency Polygon | Meaning, Steps to Draw and Examples
What is Frequency Polygon?A frequency polygon is another way to show a frequency distribution on a graph. In addition to being an alternate for the histogram, the frequency polygon is also an outcome of the histogram. While comparing two or more frequency distributions, a frequency polygon is more s
5 min read
Ogive (Cumulative Frequency Curve) and its Types
A method of presenting data in the form of graphs that provides a quick and easier way to understand the trends of the given set of data is known as Graphic Presentation. The two types of graphs through which a given set of data can be presented are Frequency Distribution Graphs and Time Series Grap
5 min read
What is Arithmetic Line-Graph or Time-Series Graph?
A time series is an arrangement in which the values of variables are recorded in relation to the time of occurrence. In the case of a long series of data, time series helps identify the trend, periodicity, etc. The time period can be defined as a year, quarter, month, week, days, hours, and so on. A
6 min read
Diagrammatic and Graphic Presentation of Data
Diagrammatic and graphic presentation of data means visual representation of the data. It shows a comparison between two or more sets of data and helps in the presentation of highly complex data in its simplest form. Diagrams and graphs are clear and easy to read and understand. In the diagrammatic
4 min read
Chapter 6: Measures of Central Tendency: Arithmetic Mean
Measures of Central Tendency in Statistics
Central tendencies in statistics are numerical values that represent the middle or typical value of a dataset. Also known as averages, they provide a summary of the entire data, making it easier to understand the overall pattern or behavior. These values are useful because they capture the essence o
11 min read
Arithmetic Mean: Meaning, Example, Types, Merits, and Demerits
A single value used to symbolise a whole set of data is called the Measure of Central Tendency. In comparison to other values, it is a typical value to which the majority of observations are closer. The arithmetic mean is one approach to measure central tendency in statistics. This measure of centra
8 min read
What is Simple Arithmetic Mean?
Arithmetic Mean is one approach to measure central tendency in statistics. This measure of central tendency involves the condensation of a huge amount of data to a single value. Arithmetic mean can be determined using two methods; viz., Simple Arithmetic Mean and Weighted Arithmetic Mean. Meaning of
11 min read
Calculation of Mean in Individual Series | Formula of Mean
What is Mean? Mean is the sum of a set of numbers divided by the total number of values. It is also referred to as the average. For instance, if there are four items in a series, i.e. 2, 5, 8, 3, and 9. The simple arithmetic mean is (2 + 5 + 8 + 3 + 9) / 5 = 5.4. What is Individual Series? The serie
2 min read
Calculation of Mean in Discrete Series | Formula of Mean
What is Mean?Mean is the sum of a set of numbers divided by the total number of values. It is also referred to as the average. For instance, if there are four items in a series, i.e. 2, 5, 8, 3, and 9. The simple arithmetic mean is (2 + 5 + 8 + 3 + 9) / 5 = 5.4.What is Discrete Series?In discrete se
3 min read
Calculation of Mean in Continuous Series | Formula of Mean
The mean, also known as the average, is a measure of central tendency that summarizes a set of data by identifying the central point. In a continuous series, data is grouped into class intervals, and the mean is calculated differently than in a discrete series. The mean provides a comprehensive over
4 min read
Calculation of Arithmetic Mean in Special Cases
A single value used to symbolise a whole set of data is called the Measure of Central Tendency. In comparison to other values, it is a typical value to which the majority of observations are closer. The arithmetic mean is one approach to measure central tendency in statistics. This measure of centra
4 min read
Weighted Arithmetic Mean
Simple Arithmetic Mean gives equal importance to all the variables in a series. However, in some situations, a greater emphasis is given to one item and less to others, i.e., ranking of the variables is done according to their significance in that situation. For example, during inflation, the price
3 min read
Chapter 7: Measures of Central Tendency: Median and Mode
Median(Measures of Central Tendency): Meaning, Formula, Merits, Demerits, and Examples
What is Median?The median is a centrally located value that splits the distribution into two equal portions, one including all values more than or equal to the median and the other containing all values less than or equal to it. The median is the " middle " element when the data set is organized in
8 min read
Calculation of Median for Different Types of Statistical Series
What is Median?When elements in the data set are organised sequentially, that is, in either an ascending or descending order of magnitude, the median can be referred to as the middle value of the data set. Its value is located in a distribution in such a way that 50% of the items are below it and 50
8 min read
Calculation of Median in Individual Series | Formula of Median
What is Median?When elements in the data set are organised sequentially, that is, in either an ascending or descending order of magnitude, the median can be referred to as the middle value of the data set. Its value locates in a distribution in such a way that 50% of the items are below it and 50% a
3 min read
Calculation of Median in Discrete Series | Formula of Median
What is Median?When elements in the data set are organised sequentially, that is, in either an ascending or descending order of magnitude, the median can be referred to as the middle value of the data set. Its value locates in a distribution in such a way that 50% of the items are below it and 50% a
3 min read
Calculation of Median in Continuous Series | Formula of Median
The median is a measure of central tendency that represents the middle value of a data set when the values are arranged in order, either ascending or descending. In a continuous series (grouped data), where data is presented in class intervals with frequencies, the median divides the distribution su
5 min read
Graphical determination of Median
A measure of central tendency that determines the centrally located value of a given series is known as the Median. The number of values of the series below and above the given series is always equal. To determine the median value of a given series, it is first managed in increasing or decreasing or
5 min read
Mode: Meaning, Formula, Merits, Demerits, and Examples
The word mode is derived from the French word 'La Mode', meaning anything that is in fashion or vogue. A measure of central tendency in statistical series that determines the value occurring most frequently in a given series is known as mode. In other words, the modal value of the series has the hig
9 min read
Calculation of Mode in Individual Series | Formula of Mode
The word mode comes from the Latin word ‘Modus’, meaning measurements, quantity, way, or manner. In statistics, Mode refers to the variable that occurs most of the time or repeats itself most frequently in a given series of variables (say X). It is a maximum occurrence at a particular point or a val
5 min read
Calculation of Mode in Discrete Series | Formula of Mode
The word mode comes from the Latin word 'Modus', meaning measurements, quantity, way, or manner. In statistics, Mode refers to the variable that occurs most of the time or repeats itself most frequently in a given series of variables (say X). It is a maximum occurrence at a particular point or a val
6 min read
Grouping Method of Calculating Mode in Discrete Series | Formula of Mode
Mode is the value from a data set that has occurred the most number of times. It is one of the most crucial measures of central tendency and is represented by Z. For example, if, in a class of 35 students, 10 students are 10 years old, 20 students are 11 years old, and the rest 5 students are 9 year
5 min read
Calculation of Mode in Continuous Series | Formula of Mode
Mode, in statistics, refers to the variable that occurs most of the time in the given series. In simple words, a mode is a variable that repeats itself most frequently in a given series of variables (say X). We can determine the mode in two series; viz., individual and discrete series. Mode is denot
7 min read
Calculation of Mode in Special Cases
The word mode is derived from the French word ‘La Mode’, meaning anything that is in fashion or vogue. A measure of central tendency in statistical series that determines the value occurring most frequently in the given series is known as mode. In other words, the modal value of the series has the h
6 min read
Calculation of Mode by Graphical Method
The word mode is derived from the French word 'La Mode', meaning anything that is in fashion or vogue. A measure of central tendency in statistical series that determines the value occurring most frequently in the given series is known as mode. In other words, the modal value of the series has the h
4 min read
Mean, Median and Mode| Comparison, Relationship and Calculation
A single value used to symbolise a whole set of data is called the Measure of Central Tendency. In comparison to other values, it is a typical value to which the majority of observations are closer. Average and Measure of Location are other names for the Measure of Central Tendency. In statistical a
7 min read
Chapter 8: Measures of Dispersion
Measures of Dispersion | Meaning, Absolute and Relative Measures of Dispersion
Averages like mean, median, and mode can be used to represent any series by a single number. However, averages are not enough to describe the characteristics of statistical data. So, it is necessary to define some additional summary measures to adequately represent the characteristics of a distribut
5 min read
Range | Meaning, Coefficient of Range, Merits and Demerits, Calculation of Range
What is Range?Range is the easiest to understand of all the measures of dispersion. The difference between the largest and smallest item in a distribution is called range. It can be written as: Range (R) = Largest item (L) – Smallest item (S) For example, If the marks of 5 students of class Xth are
4 min read
Calculation of Range and Coefficient of Range
What is Range?Range is the easiest to understand of all the measures of dispersion. The difference between the largest and smallest item in a distribution is called range. It can be written as:Range (R) = Largest item (L) – Smallest item (S)For example, If the marks of 5 students of class XIth are 2
4 min read
Interquartile Range and Quartile Deviation
The extent to which the values of a distribution differ from the average of that distribution is known as Dispersion. The measures of dispersion can be either absolute or relative. The Measures of Absolute Dispersion consist of Range, Quartile Deviation, Mean Deviation, Standard Deviation, and Loren
3 min read
Partition Value | Quartiles, Deciles and Percentiles
Partition values are statistical measures that divide a dataset into equal parts. They help in understanding the distribution and spread of data by indicating where certain percentages of the data fall. The most commonly used partition values are quartiles, deciles, and percentiles.Table of ContentW
9 min read
Quartile Deviation and Coefficient of Quartile Deviation: Meaning, Formula, Calculation, and Examples
The extent to which the values of a distribution differ from the average of that distribution is known as Dispersion. The measures of dispersion can be either absolute or relative. The Measures of Absolute Dispersion consist of Range, Quartile Deviation, Mean Deviation, Standard Deviation, and Loren
3 min read
Quartile Deviation in Discrete Series | Formula, Calculation and Examples
What is Quartile Deviation?Quartile Deviation (absolute measure) divides the distribution into multiple quarters. Quartile Deviation is calculated as the average of the difference of the upper quartile (Q3) and the lower quartile (Q1).Quartile~Deviation=\frac{Q_3-Q_1}{2} Where,Q3 = Upper Quartile (S
2 min read
Quartile Deviation in Continuous Series | Formula, Calculation and Examples
What is Quartile Deviation?Quartile Deviation (absolute measure) divides the distribution into multiple quarters. Quartile Deviation is calculated as the average of the difference of the upper quartile (Q3) and the lower quartile (Q1).Quartile~Deviation=\frac{Q_3-Q_1}{2} Where,Q3 = Upper Quartile (S
3 min read
Mean Deviation: Coefficient of Mean Deviation, Merits, and Demerits
Range, Interquartile range, and Quartile deviation all have the same defect; i.e., they are determined by considering only two values of a series: either the extreme values (as in range) or the values of the quartiles (as in quartile deviation). This approach of analysing dispersion by determining t
5 min read
Calculation of Mean Deviation for different types of Statistical Series
What is Mean Deviation?The arithmetic average of the deviations of various items from a measure of central tendency (mean, median, or mode) is known as the Mean Deviation of a series. Other names for Mean Deviation are the First Moment of Dispersion and Average Deviation. Mean deviation is calculate
3 min read
Mean Deviation from Mean | Individual, Discrete, and Continuous Series
Mean Deviation of a series can be defined as the arithmetic average of the deviations of various items from a measure of central tendency (mean, median, or mode). Mean Deviation is also known as the First Moment of Dispersion or Average Deviation. Mean Deviation is based on all the items of the seri
4 min read
Mean Deviation from Median | Individual, Discrete, and Continuous Series
What is Mean Deviation from Median?Mean Deviation of a series can be defined as the arithmetic average of the deviations of various items from a measure of central tendency (mean, median, or mode). Mean Deviation is also known as the First Moment of Dispersion or Average Deviation. Mean Deviation is
5 min read
Standard Deviation: Meaning, Coefficient of Standard Deviation, Merits, and Demerits
The methods of measuring dispersion such as quartile deviation, range, mean deviation, etc., are not universally adopted as they do not provide much accuracy. Range does not provide required satisfaction as in the entire group, range's magnitude is determined by most extreme cases. Quartile Deviatio
6 min read
Standard Deviation in Individual Series
A scientific measure of dispersion that is widely used in statistical analysis of a given set of data is known as Standard Deviation. Another name for standard deviation is Root Mean Square Deviation. Standard Deviation is denoted by a Greek Symbol σ (sigma). Under this method, the deviation of valu
3 min read
Standard Deviation in Discrete Series
A scientific measure of dispersion that is widely used in statistical analysis of a given set of data is known as Standard Deviation. Another name for standard deviation is Root Mean Square Deviation. Standard Deviation is denoted by a Greek Symbol σ (sigma). Under this method, the deviation of valu
5 min read
Standard Deviation in Frequency Distribution Series
A scientific measure of dispersion that is widely used in statistical analysis of a given set of data is known as Standard Deviation. Another name for standard deviation is Root Mean Square Deviation. It is denoted by a Greek Symbol σ (sigma). Under this method, the deviation of values is taken from
3 min read
Combined Standard Deviation: Meaning, Formula, and Example
A scientific measure of dispersion, which is widely used in statistical analysis of a given set of data is known as Standard Deviation. Another name for standard deviation is Root Mean Square Deviation. Standard Deviation is denoted by a Greek Symbol σ (sigma). Under this method, the deviation of va
2 min read
Coefficient of Variation: Meaning, Formula and Examples
What is Coefficient of Variation? As Standard Deviation is an absolute measure of dispersion, one cannot use it for comparing the variability of two or more series when they are expressed in different units. Therefore, in order to compare the variability of two or more series with different units it
2 min read
Lorenz Curveb : Meaning, Construction, and Application
What is Lorenz Curve?The variability of a statistical series can be measured through different measures, Lorenz Curve is one of them. It is a Cumulative Percentage Curve and was first used by Max Lorenz. Generally, Lorenz Curves are used to measure the variability of the distribution of income and w
4 min read