Working with Geospatial Data in Python
Last Updated :
23 Jul, 2025
Spatial data, also known as geospatial data, GIS data, or geodata, is a type of numeric data that defines the geographic location of a physical object, such as a building, a street, a town, a city, a country, or other physical objects, using a geographic coordinate system. You may determine not just the position of an object, but also its length, size, area, and shape using spatial data.
To work with geospatial data in python we need the GeoPandas & GeoPlot library
GeoPandas is an open-source project to make working with geospatial data in python easier. GeoPandas extends the data types used by pandas to allow spatial operations on geometric types. Geometric operations are performed shapely. Geopandas further depends on fiona for file access and matplotlib for plotting. GeoPandas depends on its spatial functionality on a large geospatial, open-source stack of libraries (GEOS, GDAL, and PROJ). See the Dependencies section below for more details.
Required dependencies:
- numpy
- pandas (version 0.24 or later)
- shapely (interface to GEOS)
- fiona (interface to GDAL)
- pyproj (interface to PROJ; version 2.2.0 or later)
Further, optional dependencies are:
- rtree (optional; spatial index to improve performance and required for overlay operations; interface to libspatialindex)
- psycopg2 (optional; for PostGIS connection)
- GeoAlchemy2 (optional; for writing to PostGIS)
- geopy (optional; For plotting, these additional for geocoding)
packages may be used:
- matplotlib (>= 2.2.0)
- mapclassify (>= 2.2.0)
Geoplot is a geospatial data visualization library for data scientists and geospatial analysts that want to get things done quickly. Below we'll cover the basics of Geoplot and explore how it's applied. Geoplot is for Python 3.6+ versions only.
Note: Please install all the dependencies and modules for the proper functioning of the given codes.
Installation
- Installing can be done through Anaconda:
Syntax:
conda install geopandas
conda install geoplot
- conda-forge is a community effort that provides conda packages for a wide range of software. It provides the conda-forge package channel for conda from which packages can be installed, in addition to the “defaults” channel provided by Anaconda. GeoPandas and all its dependencies are available on the conda-forge channel and can be installed as:
Syntax:
conda install --channel conda-forge geopandas
conda install geoplot -c conda-forge
- GeoPandas can also be installed with pip if all dependencies can be installed as well:
Syntax:
pip install geopandas
pip install geoplot
- You may install the latest development version by cloning the GitHub repository and using pip to install from the local directory:
Syntax:
git clone https://github.com/geopandas/geopandas
cd geopandas
pip install
- It is also possible to install the latest development version directly from the GitHub repository with:
Syntax:
pip install git+git://github.com/geopandas/geopandas.git
After installing packages along with their dependencies open a python editor like spyder. Before beginning with code we need to download some shapefiles (.shp extension). You can download country-level data as well as global-level data from here under "Free spatial data". To get shapefile used in tutorial click here.
Reading Shapefile
First, we will import the geopandas library and then read our shapefile using the variable "world_data". Geopandas can read almost any vector-based spatial data format including ESRI shapefile, GeoJSON files and more using the command:
Syntax: geopandas.read_file()
Parameters
- filename: str, path object, or file-like object. Either the absolute or relative path to the file or URL to be opened or any object with a read() method (such as an open file or StringIO)
- bbox: tuple | GeoDataFrame or GeoSeries | shapely Geometry, default None. Filter features by given bounding box, GeoSeries, GeoDataFrame or a shapely geometry. CRS mis-matches are resolved if given a GeoSeries or GeoDataFrame. Cannot be used with mask.
- mask: dict | GeoDataFrame or GeoSeries | shapely Geometry, default None. Filter for features that intersect with the given dict-like geojson geometry, GeoSeries, GeoDataFrame or shapely geometry. CRS mis-matches are resolved if given a GeoSeries or GeoDataFrame. Cannot be used with bbox.
- rows: int or slice, default None. Load in specific rows by passing an integer (first n rows) or a slice() object.
- **kwargs : Keyword args to be passed to the open or BytesCollection method in the fiona library when opening the file. For more information on possible keywords, type: import fiona; help(fiona.open)
Example:
Python3
import geopandas as gpd

# Reading the world shapefile
world_data = gpd.read_file(r'world.shp')

world_data
Output:

Plotting
If you want to check which type of data you are using then go to the console and type “type(world_data)” which tells you that it’s not pandas data, it’s a geopandas geodata. Next, we are going to plot those GeoDataFrames using plot() method.
Syntax: GeoDataFrame.plot()
Example:
Python3
import geopandas as gpd

# Reading the world shapefile
world_data = gpd.read_file(r'world.shp')

world_data.plot()
Output:

Selecting Columns
If we see the "world_data" GeoDataFrame there are many columns(Geoseries) shown, you can choose specific Geoseries by:
Syntax:
data[['attribute 1', 'attribute 2']]
Example:
Python3
import geopandas as gpd

# Reading the world shapefile
world_data = gpd.read_file(r'world.shp')

world_data = world_data[['NAME', 'geometry']]
Output:

Calculating Area
We can calculate the area of each country using geopandas by creating a new column “area” and using the area property.
Syntax:
GeoSeries.area
Returns a Series containing the area of each geometry in the GeoSeries expressed in the units of the CRS.
Example:
Python3
import geopandas as gpd

# Reading the world shapefile
world_data = gpd.read_file(r'world.shp')

world_data = world_data[['NAME', 'geometry']]

# Calculating the area of each country
world_data['area'] = world_data.area
Output:

Removing a Continent
We can remove a specific element from the Geoseries. Here we are removing the continent named "Antarctica" from the "Name" Geoseries.
Syntax:
data[data['attribute'] != 'element']
Example:
Python3
import geopandas as gpd

# Reading the world shapefile
world_data = gpd.read_file(r'world.shp')

world_data = world_data[['NAME', 'geometry']]

# Calculating the area of each country
world_data['area'] = world_data.area

# Removing Antarctica from GeoPandas GeoDataframe
world_data = world_data[world_data['NAME'] != 'Antarctica']
world_data.plot()
Output:

Visualizing a specific Country
We can visualize/plot a specific country by selecting it. In the below example, we are selecting "India" from the "NAME" column.
Syntax:
data[data.attribute=="element"].plot()
Example:
Python3
import geopandas as gpd
import matplotlib.pyplot as plt
from mpl_toolkits.axes_grid1 import make_axes_locatable

# Reading the world shapefile
world_data = gpd.read_file(r'world.shp')
world_data = world_data[['NAME', 'geometry']]

# Calculating the area of each country
world_data['area'] = world_data.area

# Removing Antarctica from GeoPandas GeoDataframe
world_data = world_data[world_data['NAME'] != 'Antarctica']
world_data[world_data.NAME=="India"].plot()
Output:

Coordinate Reference System
We can check our current Coordinate System using Geopandas CRS i.e Coordinates Reference System. Also, we can change it to a projection coordination system. The Coordinate Reference System (CRS) is represented as a pyproj.CRS object. We can check current CRS using the following syntax.
Syntax:
GeoDataFrame.crs
to_crs() method transform geometries to a new coordinate reference system. Transform all geometries in an active geometry column to a different coordinate reference system. The CRS attribute on the current GeoSeries must be set. Either CRS or epsg may be specified for output. This method will transform all points in all objects. It has no notion or projecting entire geometries. All segment joining points are assumed to be lined in the current projection, not geodesics. Objects crossing the dateline (or another projection boundary) will have undesirable behavior.
Syntax: GeoDataFrame.to_crs(crs=None, epsg=None, inplace=False)
Parameters
- crs: pyproj.CRS, optional if epsg is specified. The value can be anything accepted by pyproj.CRS.from_user_input(), such as an authority string (eg “EPSG:4326”) or a WKT string.
- epsg: int, optional if crs is specified. EPSG code specifying output projection.
- inplace: bool, optional, default: False. Whether to return a new GeoDataFrame or do the transformation in place.
Example:
Python3
import geopandas as gpd

# Reading the world shapefile
world_data = gpd.read_file(r'world.shp')

world_data = world_data[['NAME', 'geometry']]

# Calculating the area of each country
world_data['area'] = world_data.area

# Removing Antarctica from GeoPandas GeoDataframe
world_data = world_data[world_data['NAME'] != 'Antarctica']

# Changing the projection
current_crs = world_data.crs
world_data.to_crs(epsg=3857, inplace=True)

world.plot()
Output:

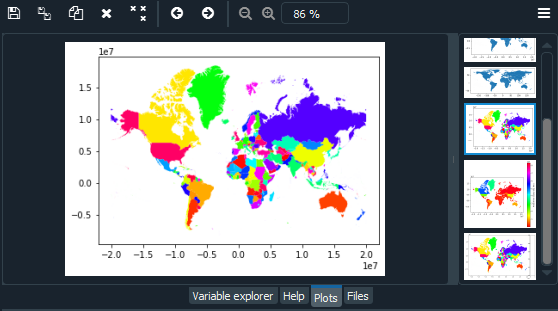
Using Color Maps (cmap)
We can color each country in the world using a head column and cmap. To find out head column type "world_data.head()" in console. We can choose different color maps(cmap) available in matplotlib. In the following code, we have colored countries using plot() arguments column and cmap.
Example:
Python3
import geopandas as gpd

# Reading the world shapefile
world_data = gpd.read_file(r'world.shp')

world_data = world_data[['NAME', 'geometry']]

# Calculating the area of each country
world_data['area'] = world_data.area

# Removing Antarctica from GeoPandas GeoDataframe
world_data = world_data[world_data['NAME'] != 'Antarctica']

# Changing the projection
current_crs = world_data.crs
world_data.to_crs(epsg=3857, inplace=True)

world_data.plot(column='NAME', cmap='hsv')
Output:
Adding a legend
Next, we are going to convert the area in sq. km by dividing it to 10^6 i.e (1000000). Output can be seen in variable explorer in the "world_data" variable.
We can add a legend to our world map along with a label using plot() arguments
- legend: bool (default False). Plot a legend. Ignored if no column is given, or if color is given.
- legend_kwds: dict (default None). Keyword arguments to pass to matplotlib.pyplot.legend() or matplotlib.pyplot.colorbar(). Additional accepted keywords when scheme is specified:
- fmt: string. A formatting specification for the bin edges of the classes in the legend. For example, to have no decimals: {"fmt": "{:.0f}"}.
- labels: list-like. A list of legend labels to override the auto-generated labels. Needs to have the same number of elements as the number of classes (k).
- interval: boolean (default False). An option to control brackets from mapclassify legend. If True, open/closed interval brackets are shown in the legend.
Example:
Python3
import geopandas as gpd

# Reading the world shapefile
world_data = gpd.read_file(r'world.shp')

world_data = world_data[['NAME', 'geometry']]

# Calculating the area of each country
world_data['area'] = world_data.area

# Removing Antarctica from GeoPandas GeoDataframe
world_data = world_data[world_data['NAME'] != 'Antarctica']
world_data.plot()

# Changing the projection
current_crs = world_data.crs
world_data.to_crs(epsg=3857, inplace=True)
world_data.plot(column='NAME', cmap='hsv')

# Re-calculate the areas in Sq. Km.
world_data['area'] = world_data.area/1000000

# Adding a legend
world_data.plot(column='area', cmap='hsv', legend=True,
                legend_kwds={'label': "Area of the country (Sq. Km.)"},
                figsize=(7, 7))
Output:

Resizing the legend
We can also resize the legend using ax and cax arguments of plot().
- ax: matplotlib.pyplot. Artist (default None). axes on which to draw the plot.
- cax: matplotlib.pyplot Artist (default None). axes on which to draw the legend in case of color map.
For this, we need matplotlib library.
The axes_divider.make_axes_locatable function takes an existing axes, adds it to a new AxesDivider, and returns the AxesDivider. The append_axes method of the AxesDivider can then be used to create new axes on a given side ("top", "right", "bottom", or "left") of the original axes. To create axes at the given position with the same height (or width) of the main axes-
Syntax:
append_axes(self, position, size, pad=None, add_to_figure=True, **kwargs)
position can take any value from: "left", "right", "bottom" or "top".
size and pad should be axes_grid.axes_size compatible.
Example:
Python3
import geopandas as gpd
import matplotlib.pyplot as plt
from mpl_toolkits.axes_grid1 import make_axes_locatable

# Reading the world shapefile
world_data = gpd.read_file(r'world.shp')

world_data = world_data[['NAME', 'geometry']]

# Calculating the area of each country
world_data['area'] = world_data.area

# Removing Antarctica from GeoPandas GeoDataframe
world_data = world_data[world_data['NAME'] != 'Antarctica']
world_data.plot()

# Changing the projection
current_crs = world_data.crs
world_data.to_crs(epsg=3857, inplace=True)
world_data.plot(column='NAME', cmap='hsv')

# Re-calculate the areas in Sq. Km.
world_data['area'] = world_data.area/1000000

# Adding a legend
world_data.plot(column='area', cmap='hsv', legend=True,
                legend_kwds={'label': "Area of the country (Sq. Km.)"},
                figsize=(7, 7))

# Resizing the legend
fig, ax = plt.subplots(figsize=(10, 10))
divider = make_axes_locatable(ax)

cax = divider.append_axes("right", size="7%", pad=0.1)
world_data.plot(column='area', cmap='hsv', legend=True,
                legend_kwds={'label': "Area of the country (Sq. Km.)"},
                ax=ax, cax=cax)
Output:

Polyplot and Pointplot Using Geoplot Library
First, we will import Geoplot library. Next, we will load one of the sample datasets(geojson file) present in geoplot. In the below example, we are going to use "world" ,"contiguous_usa","usa_cities","melbourne" and "melbourne_schools" datasets. List of datasets present in geoplot are mentioned below:
- usa_cities
- contiguous_usa
- nyc_collision_factors
- nyc_boroughs
- ny_census
- obesity_by_state
- la_flights
- dc_roads
- nyc_map_pluto_sample
- nyc_collisions_sample
- boston_zip_codes
- boston_airbnb_listings
- napoleon_troop_movements
- nyc_fatal_collisions
- nyc_injurious_collisions
- nyc_police_precincts
- nyc_parking_tickets
- world
- melbourne
- melbourne_schools
- san_francisco
- san_francisco_street_trees_sample
- california_congressional_districts
We can add our own datasets by editing the datasets.py file. Click here for some free sample datasets.
- If you have polygonal data, you can plot that using a geoplot polyplot.
- If your data consists of a bunch of points instead, you can display those points using pointplot.
Syntax :
geoplot.datasets.get_path(str)
Syntax for plotting:
geoplot.polyplot(var)
geoplot.pointplot(var)
Example:
Python3
import geoplot as gplt
import geopandas as gpd

# Reading the world shapefile
path = gplt.datasets.get_path("world")
world = gpd.read_file(path)
gplt.polyplot(world)

path = gplt.datasets.get_path("contiguous_usa")
contiguous_usa = gpd.read_file(path)
gplt.polyplot(contiguous_usa)

path = gplt.datasets.get_path("usa_cities")
usa_cities = gpd.read_file(path)
gplt.pointplot(usa_cities)

path = gplt.datasets.get_path("melbourne")
melbourne = gpd.read_file(path)
gplt.polyplot(melbourne)

path = gplt.datasets.get_path("melbourne_schools")
melbourne_schools = gpd.read_file(path)
gplt.pointplot(melbourne_schools)
World Dataset:

USA Dataset:

USA Cities Dataset:

Melbourne Dataset:

Melbourne Schools Dataset:

We can combine these two plots using overplotting. Overplotting is the act of stacking several different plots on top of one another, useful for providing additional context for our plots:
Example:
Python3
import geoplot as gplt
import geopandas as gpd

# Reading the world shapefile
path = gplt.datasets.get_path("usa_cities")
usa_cities = gpd.read_file(path)

path = gplt.datasets.get_path("contiguous_usa")
contiguous_usa = gpd.read_file(path)

path = gplt.datasets.get_path("melbourne")
melbourne = gpd.read_file(path)

path = gplt.datasets.get_path("melbourne_schools")
melbourne_schools = gpd.read_file(path)

ax = gplt.polyplot(contiguous_usa)
gplt.pointplot(usa_cities, ax=ax)

ax = gplt.polyplot(melbourne)
gplt.pointplot(melbourne_schools, ax=ax)
Output:


You may have noticed that this map of the United States appears to be odd. Because the Earth is a sphere, it is difficult to depict it in two dimensions. As a result, we use some type of projection, or means of flattening the sphere, whenever we take data off the sphere and place it on a map. When you plot data without a projection, or "carte blanche," your map will be distorted. We can “correct” the distortions by picking up a projection method. Here we are going to use Albers equal-area and WebMercator projection.
Along with this, we are also going to add some other parameters such as hue, legend, cmap, and scheme.
- The hue parameter applies a colormap to a data column.
- The legend parameter toggles a legend.
- Change the colormap using matplotlib's cmap.
- For a categorical colormap, use a scheme.
Example:
Python3
import geoplot as gplt
import geopandas as gpd
import geoplot.crs as gcrs

# Reading the world shapefile
path = gplt.datasets.get_path("contiguous_usa")
contiguous_usa = gpd.read_file(path)

path = gplt.datasets.get_path("usa_cities")
usa_cities = gpd.read_file(path)

ax = gplt.polyplot(contiguous_usa, projection=gcrs.AlbersEqualArea())
gplt.pointplot(usa_cities, ax=ax, hue="ELEV_IN_FT",cmap='rainbow',
               legend=True)

ax = gplt.webmap(contiguous_usa, projection=gcrs.WebMercator())
gplt.pointplot(usa_cities, ax=ax, hue='ELEV_IN_FT', cmap='terrain',
               legend=True)
Output:


Choropleth in Geoplot
A choropleth takes data that has been aggregated on some meaningful polygonal level (e.g. census tract, state, country, or continent) and uses color to display it to the reader. It's a well-known plot type, and it's perhaps the most general-purpose and well-known of the spatial plot types. A basic choropleth requires polygonal geometries and a hue variable. Change the colormap using matplotlib's cmap. The legend parameter toggles the legend.
Syntax:
geoplot.choropleth(var)
Example:
Python3
import geoplot as gplt
import geopandas as gpd
import geoplot.crs as gcrs

# Reading the world shapefile
boroughs = gpd.read_file(gplt.datasets.get_path('nyc_boroughs'))

gplt.choropleth(boroughs, hue='Shape_Area',
                projection=gcrs.AlbersEqualArea(),
                cmap='RdPu', legend=True)
Output:

To pass the keyword argument to the legend, use the legend_kwargs argument. To specify a categorical colormap, use a scheme. Use legend_labels and legend_values to customize the labels and values that appear in the legend. Here we are going to use mapclassify which is an open-source python library for Choropleth map classification. To install mapclassify use:
- mapclassify is available in on conda via the conda-forge channel:
Syntax:
conda install -c conda-forge mapclassify
- mapclassify is also available on the Python Package Index:
Syntax:
pip install -U mapclassify
Example:
Python3
import geoplot as gplt
import geopandas as gpd
import geoplot.crs as gcrs
import mapclassify as mc

# Reading the world shapefile
contiguous_usa = gpd.read_file(gplt.datasets.get_path('contiguous_usa'))

scheme = mc.FisherJenks(contiguous_usa['population'], k=5)

gplt.choropleth(
    contiguous_usa, hue='population', projection=gcrs.AlbersEqualArea(),
    edgecolor='white', linewidth=1,
    cmap='Reds', legend=True, legend_kwargs={'loc': 'lower left'},
    scheme=scheme,   legend_labels=[
        '<3 million', '3-6.7 million', '6.7-12.8 million',
        '12.8-25 million', '25-37 million'
    ]
)
Output:

KDE Plot in Geoplot
Kernel density estimation is a technique that non-parametrically estimates a distribution function for a set of point observations without using parameters. KDEs are a popular method for examining data distributions; in this figure, the technique is applied to a geospatial situation. A basic KDEplot takes pointwise data as input.
Syntax:
geoplot.kdeplot(var)
Example:
Python3
import geoplot as gplt
import geopandas as gpd
import geoplot.crs as gcrs

# Reading the world shapefile
boroughs = gpd.read_file(gplt.datasets.get_path('nyc_boroughs'))

collisions = gpd.read_file(gplt.datasets.get_path('nyc_collision_factors'))

ax = gplt.polyplot(boroughs, projection=gcrs.AlbersEqualArea())

gplt.kdeplot(collisions, ax=ax)
Output:

Sankey in Geoplot
A Sankey diagram depicts the flow of information through a network. It's useful for displaying the magnitudes of data flowing through a system. This figure places the Sankey diagram in a geospatial context, making it helpful for monitoring traffic loads on a road network or travel volumes between airports, for example. A basic Sankey requires a GeoDataFrame of LineString or MultiPoint geometries. hue adds color gradation to the map. Use matplotlib's cmap to control the colormap. For a categorical colormap, specify the scheme. legend toggles a legend. Here we are using Mollweide projection
Syntax;
geoplot.sankey(var)
Example:
Python3
import geoplot as gplt
import geopandas as gpd
import geoplot.crs as gcrs
import mapclassify as mc

# Reading the world shapefile
la_flights = gpd.read_file(gplt.datasets.get_path('la_flights'))
world = gpd.read_file(gplt.datasets.get_path('world'))
scheme = mc.Quantiles(la_flights['Passengers'], k=5)

ax = gplt.sankey(la_flights, projection=gcrs.Mollweide(),
                 scale='Passengers', hue='Passengers',
                 scheme=scheme, cmap='Oranges', legend=True)

gplt.polyplot(world, ax=ax, facecolor='lightgray', edgecolor='white')
ax.set_global(); ax.outline_patch.set_visible(True)
Output:

Similar Reads
Python Tutorial - Learn Python Programming Language Python is one of the most popular programming languages. It’s simple to use, packed with features and supported by a wide range of libraries and frameworks. Its clean syntax makes it beginner-friendly. It'sA high-level language, used in web development, data science, automation, AI and more.Known fo
10 min read
Python Fundamentals
Python IntroductionPython was created by Guido van Rossum in 1991 and further developed by the Python Software Foundation. It was designed with focus on code readability and its syntax allows us to express concepts in fewer lines of code.Key Features of PythonPython’s simple and readable syntax makes it beginner-frien
3 min read
Input and Output in PythonUnderstanding input and output operations is fundamental to Python programming. With the print() function, we can display output in various formats, while the input() function enables interaction with users by gathering input during program execution. Taking input in PythonPython's input() function
7 min read
Python VariablesIn Python, variables are used to store data that can be referenced and manipulated during program execution. A variable is essentially a name that is assigned to a value. Unlike many other programming languages, Python variables do not require explicit declaration of type. The type of the variable i
6 min read
Python OperatorsIn Python programming, Operators in general are used to perform operations on values and variables. These are standard symbols used for logical and arithmetic operations. In this article, we will look into different types of Python operators. OPERATORS: These are the special symbols. Eg- + , * , /,
6 min read
Python KeywordsKeywords in Python are reserved words that have special meanings and serve specific purposes in the language syntax. Python keywords cannot be used as the names of variables, functions, and classes or any other identifier. Getting List of all Python keywordsWe can also get all the keyword names usin
2 min read
Python Data TypesPython Data types are the classification or categorization of data items. It represents the kind of value that tells what operations can be performed on a particular data. Since everything is an object in Python programming, Python data types are classes and variables are instances (objects) of thes
9 min read
Conditional Statements in PythonConditional statements in Python are used to execute certain blocks of code based on specific conditions. These statements help control the flow of a program, making it behave differently in different situations.If Conditional Statement in PythonIf statement is the simplest form of a conditional sta
6 min read
Loops in Python - For, While and Nested LoopsLoops in Python are used to repeat actions efficiently. The main types are For loops (counting through items) and While loops (based on conditions). In this article, we will look at Python loops and understand their working with the help of examples. For Loop in PythonFor loops is used to iterate ov
9 min read
Python FunctionsPython Functions is a block of statements that does a specific task. The idea is to put some commonly or repeatedly done task together and make a function so that instead of writing the same code again and again for different inputs, we can do the function calls to reuse code contained in it over an
9 min read
Recursion in PythonRecursion involves a function calling itself directly or indirectly to solve a problem by breaking it down into simpler and more manageable parts. In Python, recursion is widely used for tasks that can be divided into identical subtasks.In Python, a recursive function is defined like any other funct
6 min read
Python Lambda FunctionsPython Lambda Functions are anonymous functions means that the function is without a name. As we already know the def keyword is used to define a normal function in Python. Similarly, the lambda keyword is used to define an anonymous function in Python. In the example, we defined a lambda function(u
6 min read
Python Data Structures
Python StringA string is a sequence of characters. Python treats anything inside quotes as a string. This includes letters, numbers, and symbols. Python has no character data type so single character is a string of length 1.Pythons = "GfG" print(s[1]) # access 2nd char s1 = s + s[0] # update print(s1) # printOut
6 min read
Python ListsIn Python, a list is a built-in dynamic sized array (automatically grows and shrinks). We can store all types of items (including another list) in a list. A list may contain mixed type of items, this is possible because a list mainly stores references at contiguous locations and actual items maybe s
6 min read
Python TuplesA tuple in Python is an immutable ordered collection of elements. Tuples are similar to lists, but unlike lists, they cannot be changed after their creation (i.e., they are immutable). Tuples can hold elements of different data types. The main characteristics of tuples are being ordered , heterogene
6 min read
Dictionaries in PythonPython dictionary is a data structure that stores the value in key: value pairs. Values in a dictionary can be of any data type and can be duplicated, whereas keys can't be repeated and must be immutable. Example: Here, The data is stored in key:value pairs in dictionaries, which makes it easier to
7 min read
Python SetsPython set is an unordered collection of multiple items having different datatypes. In Python, sets are mutable, unindexed and do not contain duplicates. The order of elements in a set is not preserved and can change.Creating a Set in PythonIn Python, the most basic and efficient method for creating
10 min read
Python ArraysLists in Python are the most flexible and commonly used data structure for sequential storage. They are similar to arrays in other languages but with several key differences:Dynamic Typing: Python lists can hold elements of different types in the same list. We can have an integer, a string and even
9 min read
List Comprehension in PythonList comprehension is a way to create lists using a concise syntax. It allows us to generate a new list by applying an expression to each item in an existing iterable (such as a list or range). This helps us to write cleaner, more readable code compared to traditional looping techniques.For example,
4 min read
Advanced Python
Python OOPs ConceptsObject Oriented Programming is a fundamental concept in Python, empowering developers to build modular, maintainable, and scalable applications. OOPs is a way of organizing code that uses objects and classes to represent real-world entities and their behavior. In OOPs, object has attributes thing th
11 min read
Python Exception HandlingPython Exception Handling handles errors that occur during the execution of a program. Exception handling allows to respond to the error, instead of crashing the running program. It enables you to catch and manage errors, making your code more robust and user-friendly. Let's look at an example:Handl
6 min read
File Handling in PythonFile handling refers to the process of performing operations on a file, such as creating, opening, reading, writing and closing it through a programming interface. It involves managing the data flow between the program and the file system on the storage device, ensuring that data is handled safely a
4 min read
Python Database TutorialPython being a high-level language provides support for various databases. We can connect and run queries for a particular database using Python and without writing raw queries in the terminal or shell of that particular database, we just need to have that database installed in our system.A database
4 min read
Python MongoDB TutorialMongoDB is a popular NoSQL database designed to store and manage data flexibly and at scale. Unlike traditional relational databases that use tables and rows, MongoDB stores data as JSON-like documents using a format called BSON (Binary JSON). This document-oriented model makes it easy to handle com
2 min read
Python MySQLMySQL is a widely used open-source relational database for managing structured data. Integrating it with Python enables efficient data storage, retrieval and manipulation within applications. To work with MySQL in Python, we use MySQL Connector, a driver that enables seamless integration between the
9 min read
Python PackagesPython packages are a way to organize and structure code by grouping related modules into directories. A package is essentially a folder that contains an __init__.py file and one or more Python files (modules). This organization helps manage and reuse code effectively, especially in larger projects.
12 min read
Python ModulesPython Module is a file that contains built-in functions, classes,its and variables. There are many Python modules, each with its specific work.In this article, we will cover all about Python modules, such as How to create our own simple module, Import Python modules, From statements in Python, we c
7 min read
Python DSA LibrariesData Structures and Algorithms (DSA) serve as the backbone for efficient problem-solving and software development. Python, known for its simplicity and versatility, offers a plethora of libraries and packages that facilitate the implementation of various DSA concepts. In this article, we'll delve in
15 min read
List of Python GUI Library and PackagesGraphical User Interfaces (GUIs) play a pivotal role in enhancing user interaction and experience. Python, known for its simplicity and versatility, has evolved into a prominent choice for building GUI applications. With the advent of Python 3, developers have been equipped with lots of tools and li
11 min read
Data Science with Python
NumPy Tutorial - Python LibraryNumPy (short for Numerical Python ) is one of the most fundamental libraries in Python for scientific computing. It provides support for large, multi-dimensional arrays and matrices along with a collection of mathematical functions to operate on arrays.At its core it introduces the ndarray (n-dimens
3 min read
Pandas TutorialPandas is an open-source software library designed for data manipulation and analysis. It provides data structures like series and DataFrames to easily clean, transform and analyze large datasets and integrates with other Python libraries, such as NumPy and Matplotlib. It offers functions for data t
6 min read
Matplotlib TutorialMatplotlib is an open-source visualization library for the Python programming language, widely used for creating static, animated and interactive plots. It provides an object-oriented API for embedding plots into applications using general-purpose GUI toolkits like Tkinter, Qt, GTK and wxPython. It
5 min read
Python Seaborn TutorialSeaborn is a library mostly used for statistical plotting in Python. It is built on top of Matplotlib and provides beautiful default styles and color palettes to make statistical plots more attractive.In this tutorial, we will learn about Python Seaborn from basics to advance using a huge dataset of
15+ min read
StatsModel Library- TutorialStatsmodels is a useful Python library for doing statistics and hypothesis testing. It provides tools for fitting various statistical models, performing tests and analyzing data. It is especially used for tasks in data science ,economics and other fields where understanding data is important. It is
4 min read
Learning Model Building in Scikit-learnBuilding machine learning models from scratch can be complex and time-consuming. Scikit-learn which is an open-source Python library which helps in making machine learning more accessible. It provides a straightforward, consistent interface for a variety of tasks like classification, regression, clu
8 min read
TensorFlow TutorialTensorFlow is an open-source machine-learning framework developed by Google. It is written in Python, making it accessible and easy to understand. It is designed to build and train machine learning (ML) and deep learning models. It is highly scalable for both research and production.It supports CPUs
2 min read
PyTorch TutorialPyTorch is an open-source deep learning framework designed to simplify the process of building neural networks and machine learning models. With its dynamic computation graph, PyTorch allows developers to modify the network’s behavior in real-time, making it an excellent choice for both beginners an
7 min read
Web Development with Python
Flask TutorialFlask is a lightweight and powerful web framework for Python. It’s often called a "micro-framework" because it provides the essentials for web development without unnecessary complexity. Unlike Django, which comes with built-in features like authentication and an admin panel, Flask keeps things mini
8 min read
Django Tutorial | Learn Django FrameworkDjango is a Python framework that simplifies web development by handling complex tasks for you. It follows the "Don't Repeat Yourself" (DRY) principle, promoting reusable components and making development faster. With built-in features like user authentication, database connections, and CRUD operati
10 min read
Django ORM - Inserting, Updating & Deleting DataDjango's Object-Relational Mapping (ORM) is one of the key features that simplifies interaction with the database. It allows developers to define their database schema in Python classes and manage data without writing raw SQL queries. The Django ORM bridges the gap between Python objects and databas
4 min read
Templating With Jinja2 in FlaskFlask is a lightweight WSGI framework that is built on Python programming. WSGI simply means Web Server Gateway Interface. Flask is widely used as a backend to develop a fully-fledged Website. And to make a sure website, templating is very important. Flask is supported by inbuilt template support na
6 min read
Django TemplatesTemplates are the third and most important part of Django's MVT Structure. A Django template is basically an HTML file that can also include CSS and JavaScript. The Django framework uses these templates to dynamically generate web pages that users interact with. Since Django primarily handles the ba
7 min read
Python | Build a REST API using FlaskPrerequisite: Introduction to Rest API REST stands for REpresentational State Transfer and is an architectural style used in modern web development. It defines a set or rules/constraints for a web application to send and receive data. In this article, we will build a REST API in Python using the Fla
3 min read
How to Create a basic API using Django Rest Framework ?Django REST Framework (DRF) is a powerful extension of Django that helps you build APIs quickly and easily. It simplifies exposing your Django models as RESTfulAPIs, which can be consumed by frontend apps, mobile clients or other services.Before creating an API, there are three main steps to underst
4 min read
Python Practice
Python QuizThese Python quiz questions are designed to help you become more familiar with Python and test your knowledge across various topics. From Python basics to advanced concepts, these topic-specific quizzes offer a comprehensive way to practice and assess your understanding of Python concepts. These Pyt
3 min read
Python Coding Practice ProblemsThis collection of Python coding practice problems is designed to help you improve your overall programming skills in Python.The links below lead to different topic pages, each containing coding problems, and this page also includes links to quizzes. You need to log in first to write your code. Your
1 min read
Python Interview Questions and AnswersPython is the most used language in top companies such as Intel, IBM, NASA, Pixar, Netflix, Facebook, JP Morgan Chase, Spotify and many more because of its simplicity and powerful libraries. To crack their Online Assessment and Interview Rounds as a Python developer, we need to master important Pyth
15+ min read