
 Data Structure
 Networking
 RDBMS
RDBMS Operating System
 Java
Java MS Excel
 iOS
iOS HTML
HTML CSS
CSS Android
 Python
 C Programming
 C++
C++ C#
C# MongoDB
 MySQL
MySQL Javascript
 PHP
PHP
- Selected Reading
- UPSC IAS Exams Notes
- Developer's Best Practices
- Questions and Answers
- Effective Resume Writing
- HR Interview Questions
- Computer Glossary
- Who is Who
Plot a Vertical line in Matplotlib
Python provides a powerful library named Matplotlib that creates visual representations in the form of plots and graphs. One of the many features of this library is the ability to plot vertical lines that are used to add a reference line or highlight a specific point on the given plot. The built-in methods 'axvline()', 'vlines()', and 'plot()' of Matplotlib are used to plot vertical lines with customizable parameters such as position, color, and linestyle. We are going to explain these methods with the help of example programs.
Plotting vertical line using Matplotlib
Let's discuss the in-built methods of Matplotlib along with their example program that will show us how to plot vertical lines.
Using axvline() method
It is the simplest way of plotting a vertical line in Matplotlib. The advantage of using this method is that it is easy and convenient. However, the disadvantage is that it does not allow us to specify the y-range of the line. The axvline() method takes a single argument that specifies the x-coordinate of the vertical line. It can take additional arguments that we will discuss later.
Syntax
axvline(x = position)
Here, position specifies the place of vertical line on the x-coordinate.
Example 1
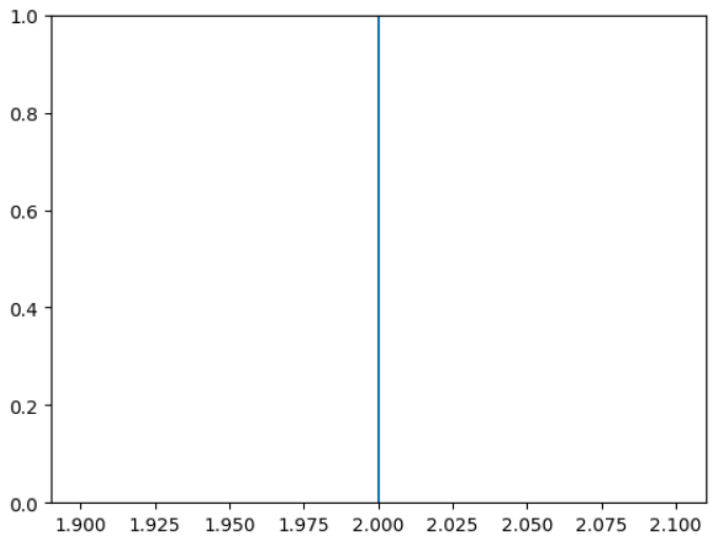
In this example, we will plot a vertical line that spans the entire y-axis of the plot. The position of the line will be 2 on the x-coordinate.
import matplotlib.pyplot as plt
plt.axvline(x = 2)
plt.show()
Output
Example 2
This is another example to plot a vertical line that spans the entire y-axis of the plot. But this time, we will customize the appearance of the line by passing additional arguments to axvline(), such as color, linestyle, and alpha.
import matplotlib.pyplot as plt
plt.axvline(x = 2, color = 'red', linestyle = '--', alpha = 0.5)
plt.show()
Output

We have plotted a dashed red line at position 2 on the x-coordinate with 50% transparency.
Using plot() method
This is another way to plot a vertical line in Matplotlib. Unlike axvline(), it allows us to specify the y-range of the line. To draw a vertical line using plot(), pass two points with the same x-coordinate and different y-coordinates as arguments.
Syntax
plot([x1, x2], [y1, y2])
Example 1
In the following example, we will plot a vertical line at position 2 on the x-coordinate and from 1 to 3 on the y-coordinate.
import matplotlib.pyplot as plt
plt.plot([2, 2], [1, 3])
plt.show()
Output

Example 2
In this example, we will customize the appearance of the line by passing additional arguments to plot(), such as color, linestyle, and marker.
import matplotlib.pyplot as plt
plt.plot([2, 2], [1, 3], color = 'blue', linestyle = ':', marker = 'o')
plt.show()
Output

In the above code, we have plotted a dotted blue line with circles at the endpoints.
Using vlines() method
It is the third way of plotting a vertical line in Matplotlib. It takes three arguments: x, ymin and ymax, which are the x-coordinate, and the lower and upper y-coordinates respectively of the vertical line.
Syntax
vlines(x = position, ymin = position, ymax = position)
Example 1
The following example illustrates how we can plot a vertical line with the help of vlines().
import matplotlib.pyplot as plt
plt.vlines(x = 3, ymin = 1, ymax = 3)
plt.show()
Output

In the above code, we have plotted a vertical line at position 3 on the x-coordinate and from 1 to 3 on the y-coordinate.
Example 2
In this example, we will customize the appearance of the line by passing additional arguments to vlines(), such as color and linewidth.
import matplotlib.pyplot as plt
plt.vlines(x = 2, ymin = 1, ymax = 3, color = 'green', linewidth = 3)
plt.show()
Output

We have changed the code of the previous example to plot a solid green line with a thick linewidth of 3.
Conclusion
In this article, we have learned how to plot a vertical line using Matplotlib. We have seen three ways of doing this operation: using 'axvline()', 'vlines()', and 'plot()' methods. Each method has its own advantages and disadvantages depending on our needs and preferences.

9K+ Views
